
Unraveling the doping mechanisms in lithium iron phosphate


Abstract
As a result of the extensive research and application of LiFePO4 (LFP) in the past > 20 years, there is now a relatively in-depth understanding of its structural stability, phase transition mechanism and electrochemical properties. However, the difficulties faced by further improving the performance of LFP due to its intrinsic low electronic and ionic conductivity have not yet been effectively solved. In order to unlock the effect of transition metal doping on the physicochemical properties of LFP, we establish doping models for all 3d, 4d and 5d transition metals in LFP and compare and analyze their structural properties, band gaps, formation energies, elastic properties, anisotropies and lithiation/delithiation voltages using ab-initio computational screening. According to our screening results, the V-, Mn-, Ni-, Rh- and Os-doped LFP structures have excellent electrochemical properties and can be used as high-performance cathode materials for Li-ion batteries.
Keywords
INTRODUCTION
Olivine-type LiFePO4 (LFP) was first proposed as a cathode for lithium-ion batteries (LIBs) in 1997 by J. B. Goodenough, a Nobel Prize winner for Chemistry in 2019[1]. Subsequently, LFP has been the focus of significant research because of its high theoretical capacity (170 mAh·g-1), good stability, high safety and environmental friendliness[2-6]. Currently, LFP is mainly used in electric vehicles, hybrid electric vehicles and communication backup power supplies[7-10]. However, its poor electronic and lithium-ion conductivities represent bottlenecks that limit its further applications[11-13].
To further improve the electrochemical properties of LFP in LIBs, researchers have adopted a variety of strategies, including the nanocrystallization of grains[14,15], the coating of carbon-based materials[16-20] and single/double element doping[21-24]. Among the above-mentioned strategies, the doping of metal cations on the Fe site of LFP has been proved to be an effective method to improve its performance[25-31]. For instance, the doping of Mo, Nb, Mn and Co has been shown to improve the electronic conductivity of LFP[32]. However, the general influence of the doping of metal elements on the structural stability of LFP remains uncertain, despite its significant importance for the safety and stability of electrode materials and the overall battery. The effect of doping on the stability of LFP should be fully studied before the further large-scale application of doped LFP. The discharge capacity of solid-state prepared LFP decreased from 149 to 117 mAh·g-1 with obvious cracks occurring after 60 cycles at 30 mA·g-1, showing a significant reduction in electronic conductivity and capacity[33]. The degree of polarization and the number of cracks increase with the number of cycles due to the anisotropy, internal strain and the lithiation/delithiation process of lithium ions in LFP[33]. The crystal structure of LFP shows obvious anisotropy, and its elastic constant and bulk and shear elastic moduli show obvious changes during charging and discharging, which accelerate the collapse of its crystal structure[34].
As the earliest commercial cathode material of LIBs, doping at the Co site of LiCoO2 (LCO) is known to play an active role in limiting its phase change and improving its cyclic stability[35]. In Fe-doped LCO (LiFexCo1-xO2, 0 ≤ x ≤ 0.25), there is no significant change in the symmetry of the crystal structure of LCO during charging and discharging[35]. In M-doped LCO (LiM0.02Co0.98O2, M = Mo, V or Zr), the increased first-cycle irreversible capacity loss is 15, 22 and 45 mAh·g-1 for Zr, Mo and V, respectively, and the cycling performance of all doped LCO models is inferior to that of pure LCO, illustrating that doping does not necessarily improve the electrochemical properties of the host material[36]. Mn-, Co-, Nb- and Mo-doped LFP models have relatively low formation energy and show improved mechanical stability[32]. The degree of anisotropy and the risk of microcracking in Mn-, Co-, Nb- and Mo-doped LFP models have been reduced[32]. Similar to doped LCO models, the symmetry and stability of the crystal structures of doped LFP models can change, so doping at the Fe site of LFP may play a positive role in its charge conduction capacity and structural stability. In general, the doping mechanisms of transition metals for LFP are still unclear.
Therefore, in order to unlock the effect of transition metal doping on the physical and chemical properties of LFP, particularly its stability and electronic conductivity, we establish models for all 3d, 4d and 5d transition metals doped in LFP (TM-LFP). We then compare and analyze their structural properties, band gaps, formation energies, elastic properties, anisotropies and lithiation/delithiation voltages using ab-initio computational screening based on six screening standards. Based on the results of this work, the TM-LFP models with high electronic conductivity, electrochemical stability and capacitive performance are identified and analyzed in detail.
COMPUTATIONAL METHODS
All the calculations of the TM-LFP models considered in this work were conducted using density functional theory (DFT) on the basis of the projector augmented wave (PAW) method and the Vienna Ab-initio Simulation Package (VASP)[37,38]. The general gradient approximation (GGA) method with the parameters of Perdew-Burke-Ernzerhof (PBE) was used for the exchange-correlation functionals in this work[39]. The cutoff energy for the lattice optimization and property calculations was set as 500 eV for the expansion of the plane waves. Spin-polarized DFT was used to consider the possible magnetization in the doped models. The temperature width was set as 0.1 eV using the Gaussian electronic smearing method for the energy minimization of the electronic steps[40].
RESULTS AND DISCUSSION
In order to screen the TM-LFP structures with high electronic conductivity and structural stability, six indicators Supplementary Table 1, including the changes in lattice parameters and cell volumes, electronic properties, formation energies, elastic properties, anisotropies and lithiation/delithiation voltages, were considered in this work. The relative stability of the lattice structures and cell volumes are the premise for the excellent electrochemical properties of the corresponding structures. Small band gaps are a necessary prerequisite for electrode materials to have good electronic conductivity[41]. A lower dopant formation energy is the determining factor that doping models can be easier to successfully synthesize experimentally. Good elasticity is an important parameter for electrode materials to be able to restore their original appearance as much as possible after multiple charge-discharge cycles. High anisotropy makes the electrode material prone to cracks and reduces its cycle performance. The higher operating voltage of a particular electrode material allows the battery made with it to have a higher energy density. The six screening criteria selected for this work correspond to the key issues in the study of electrode materials, such as ease of synthesis (crystal structure properties and dopant formation energy), cyclic stability of the electrode (elastic properties and anisotropy), conductivity (band gap) and high energy and power density (high voltage). Therefore, the six indicators considered in this screening are practical and reasonable. The basic research contents and calculation methods are shown in Section 1 of the Supporting Information.
Screening for TM-LFP models with smaller cell volume changes
The cells of the LFP and TM-LFP models are shown in Figure 1A and B and Supplementary Figures 1-6, with the corresponding atomic fractional positions, atomic lattice constants and cell volumes presented in Figure 1C and D and Supplementary Tables 2-16. The optimized lattice constants of the considered LFP-based models (LFP and TM-LFP) are listed in Supplementary Table 17 and Supplementary Figure 7, which are consistent with some previously reported experimental and computational studies[32,42,43]. As can be seen from Figure 1C, both the lattice parameters and cell volumes of the TM-LFP models do not change significantly compared with LFP, with changes of less than 5.3% for lattice a, 2.1% for lattice b, 1.5% for lattice c and 8.4% for the cell volume [Supplementary Figures 7 and 8]. Therefore, the TM doping at the Fe site of LFP did not significantly change the crystal structure and volume of the LFP itself and compared with lattices b and c, the most varied lattice a is only 5.3% for the La-LFP models. It is noteworthy that the degree of change of the three cell parameters of LFP is not consistent by doping at the Fe site of LFP, showing that the introduction of dopants makes the stress inside the lattice of LFP change in the three directions to varying degrees, which will be studied in the following sections (i.e., screening for higher elastic properties of TM-LFP and screening for higher isotropy of TM-LFP).
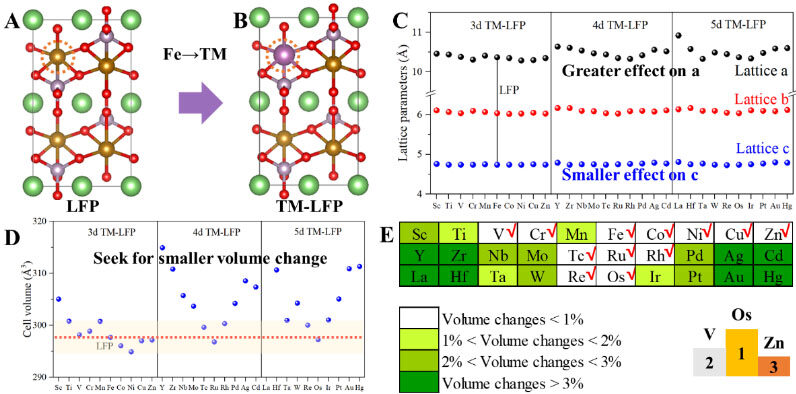
Figure 1. Screening for smaller volume changes of TM-LFP. A: Cell structure of LFP. B: Cell structure of TM-LFP with a TM doped at Fe site. C: Lattice parameters of LFP and TM-LFP, where doping has a greater effect on the length of the “a” direction than the “c” direction. D: Cell volumes of LFP and TM-LFP. The light-yellow region denotes TM-doped structures with small volume changes. E: Changes in cell volume of TM-LFP compared with LFP and three structures with minimal volume variations, where the darker the color, the greater the volume of TM-LFP changes from LFP. LFP: LiFePO4; TM-LFP: Transition metal-doped LFP.
Generally, the TM-LFP models with TM elements in the groups of IIIB to IVB and IB to IIB induce the greatest changes in the LFP lattice, as presented by the red and orange areas of Figure 1E, which may be because these TMs have the outermost electronic structure that differs significantly from Fe in group VIII. Depending on the extent of the cell volume changes, sixteen TM-LFP models with volume changes of less than 2% relative to LFP were filtered out, as shown in the yellow and white areas in Figure 1E. The three TM-doped LFP structures with the smallest cell volume variations are Os-LFP, V-LFP and Zn-LFP, as shown in the right-bottom corner of Figure 1E.
Screening for TM-LFP models with smaller band gaps
According to the calculation results of the parameters set by this work, the band gap of LFP is 0.42 eV, and the replacement of TM atoms at the Fe site of LFP can effectively reduce the band gap of LFP, except for the doping of Zn atoms, as shown in Figures 2A-C and Supplementary Table 18. To specify the effect of TM doping on the electronic structure of LFP, we chose Mn to explain the Fe site doping of LFP as an example, as shown in Figure 2A. The Mn s and p electron orbitals have no electronic states in the range of -5 to 5 eV. The Mn d orbital has obvious electronic states at three positions of -1.3, 0.3 and 1.8 eV, which has an obvious regulating effect on the total electronic DOS of LFP.
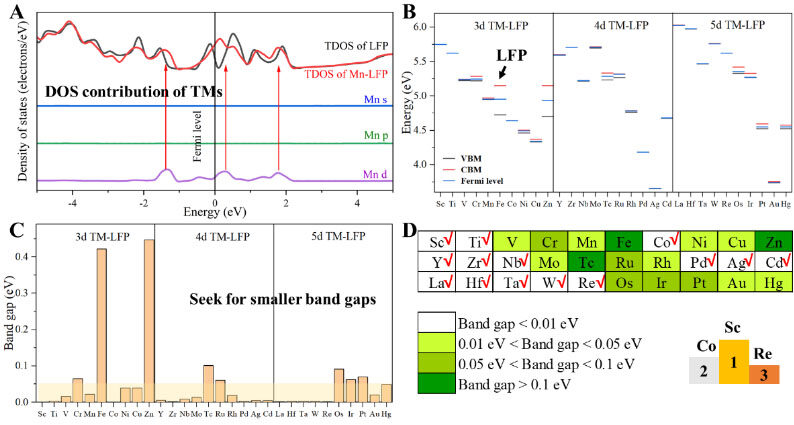
Figure 2. Screening for smaller band gaps of TM-LFP. A: Total electronic density of states (DOS) of LFP and Mn-LFP (taking Mn as an example) and projected DOS of Mn s, p and d states in Mn-LFP, where the Fermi levels of LFP and Mn-LFP are shifted to 0 eV. The DOS near the Fermi level mainly consists of Mn d states. B: Valence band maxima, conduction band minima and Fermi levels of all 3d, 4d and 5d TM-doped LFP models. C: Band gaps of LFP and TM-LFP. The light-yellow region denotes TM-doped structures with smaller band gaps and higher electronic conductivity. D: Band gaps of all 3d, 4d and 5d TM-doped LFP models compared with LFP, where the darker the color, the greater the band gaps. LFP: LiFePO4; TM-LFP: Transition metal-doped LFP.
Overall, all the 3d, 4d and 5d TM dopants, except for Zn and Tc, significantly reduced the band gap of LFP, which dropped below 0.1 eV, as shown in Figures 2B and C. The values of the band gap of each model considered in this work are shown in Supplementary Table 18 and Supplementary Figure 8. The structural models of band gaps of less than 0.05 eV are considered feasible in the white and yellow areas of Figure 2D and Supplementary Figure 9A. There is a strong linear relationship between the electronic structure (d-band) of the dopant and the total electronic DOS, as shown in Supplementary Figure 9B. The three TM-doped LFP models with the smallest band gaps are Sc-LFP, Co-LFP and Re-LFP, as shown in the right-bottom corner of Figure 2D.
Screening for TM-LFP models with lower formation energy
Dopant formation energy is an important indicator to theoretically predict the possibility of the formation of a doped structure and the smaller its corresponding value, the easier it is to form experimentally[44-46]. The formation energy of a reaction process that is greater (lower) than 0 eV indicates that the corresponding reaction process is endothermic (exothermic). Formation energy is achieved by calculating the energy differences before and after the formation of the research system, as shown in Equation (1)[47]:

where E totalis the total energy of a defective or impurity-containing system, E pureis the total energy of the pure system. niis the quantity of atoms of type i that have been added to (ni> 0) or removed from (ni< 0) the pure system and μiis the chemical potential of the corresponding added or removed atoms.
Specifically, for the TM-doped LFP models considered in this work, the corresponding dopant formation energy can be calculated by Equation (2):

where  is the total energy of the TM-doped LFP model,
  is the total energy of pure LFP, EFeand EMare the chemical potentials of Fe and the doped TM atoms, respectively, and n = 1 (one Fe atom of LFP has been replaced by one particular TM atom) in this work. The formation energies of the TM-doped LFP models are illustrated in Figure 3A and Supplementary Table 19. The TM-LFP models with TM atoms in the IIIB to VIB groups usually exhibit a formation energy lower than 0 eV, while the models with TM atoms in the VIIB to IIB groups usually exhibit a formation energy larger than 0 eV. According to previous reports, structures with a formation energy of less than 2 eV are relatively easy to form experimentally[44,45]. Therefore, the LFP structures doped by TMs in the IIIB to VIB groups are relatively easier to form. The formation energies of LFP doped by Zn, Pd, Ag, Cd, Pt, Au and Hg are greater than 2 eV, indicating that these materials are difficult to form by doping in experiments, while others are possible [Supplementary Figure 10]. The formation energy of Sc-, Ti-, V-, Cr-, Y-, Zr-, Nb-, Mo-, Ru-, La-, Hf-, Ta- and W-doped LFP are less than 0 eV, which are very easy to form experimentally by doping.
Therefore, the structural models of formation energies less than 2 eV, in the orange, yellow and white areas of Figure 3B, are considered feasible in this work. The structures of the three TM-doped LFPs with the lowest doping formation energies are Y-LFP, Hf-LFP and La-LFP, as shown in the right-bottom corner of Figure 3B.
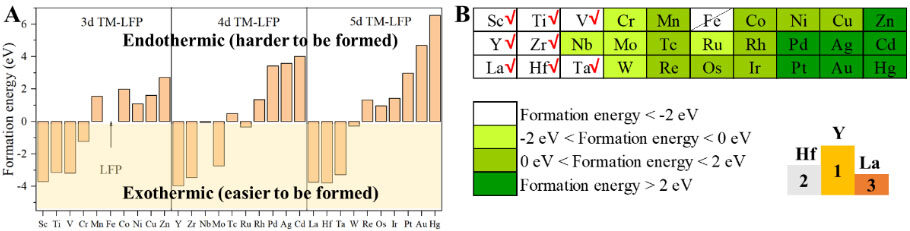
Figure 3. Screening for smaller dopant formation energy of TM-LFP. A: Formation energies of LFP and TM-LFP. The white and light-yellow areas correspond to the elements with endothermic and exothermic formation, respectively. B: Classification of formation energy of TM-LFP compared with LFP, where the darker the color, the larger the formation energy. LFP: LiFePO4; TM-LFP: Transition metal-doped LFP.
Screening for TM-LFP models with higher elastic properties
The stability of electrode materials, especially elasticity properties, is of great significance in determining the electrochemical properties of LIBs[48-50]. Poor material stability is usually demonstrated by phase change and degradation, in which the main impact is the cycling properties of the assembled LIBs by the electrode material[51]. Therefore, it is necessary to study the stability of materials by theoretical calculations, with many relevant research works having been carried out[32,52-55].
In this work, we calculated the elasticity of all 3d, 4d and 5d TM-doped LFP models. The stiffness coefficient (cij) and compliance coefficient (sij) are used to calculate the elastic properties of the above materials, which are intrinsic properties. The cij and sij of a single degree of freedom are reciprocal to each other[32]. In materials with orthorhombic crystal structures (like LFP), c11, c22 and c33 correspond to linear compressibility in the X, Y and Z directions, respectively, shown in Figure 4A, while c44, c55 and c66 correspond to the shear strengths in {100}, {010} and {001}, respectively, shown in Figure 4B. In contrast, when the materials are elongated longitudinally, they interact in the lateral direction. c12, c13 and c23 indicate the interactions between the X and Y, X and Z, and X and Z directions, respectively.
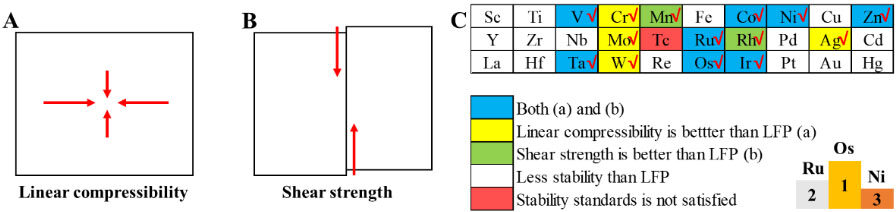
Figure 4. Screening for higher elastic properties of TM-LFP. A: Model of linear compressibility. B: Model of shear strength. C: Structural stabilities of TM-LFP and LFP considered by stability standards, linear compressibility and shear strength. Models with higher stability are shown in yellow, green and blue. LFP: LiFePO4.
The calculated cij are shown in Supplementary Tables 20-50. It can be seen that, with the introduction of TMs, the original orthorhombic structure of LFP undergoes a slight deformation, which we deem the pseudo-orthorhombic structure. This explains the reason why the cij results we calculated are slightly different from standard LFP. The stability criteria for orthorhombic crystal structures are shown by Equations (3-5):
c11 > 0, c22 > 0, c33 > 0, c44 > 0, c55 > 0, c66 > 0 (3)
c11 + c22 + c33 +2(c12 + c13+ c23) > 0 (4)
c11 + c22 -2c12 > 0, c11 + c33 - 2c13 > 0, c22 + c33 - 2c23 > 0 (5)
Based on the results of our calculations and with reference to the stability criteria in Equations (3-5), we have summarized the cij corresponding to the LFP doped with all 3d to 5d transition metals, as shown in Figure 4C. The Tc-LFP model does not meet the stability criteria in the above formula. Overall, the linear compressibility-related coefficients of the above materials are greater than the shear-dependent coefficients, which indicates that they are more sensitive to shear strain. The linear compressibility of TM-LFP in X is shown in Supplementary Figure 11, which has been improved with TM = Os, Mo, Ta, Ni, Ru and Zn. The linear compressibility of TM-LFP in Y is shown in Supplementary Figure 12, which has been improved with TM = Ir, Os, Ta, Zn, Ni, Ru, Ag and W. The linear compressibility of TM-LFP in Z is shown in Supplementary Figure 13, which has been improved with TM = Co, Os, Cr and V. The interaction between X and Y is shown in Supplementary Figure 14, which has been improved with TM = Ru, Os, Zn, Ir and Ni. The interaction between Y and Z is shown in Supplementary Figure 15, which has been improved with TM = Ru, Ta, V, Co, Os, Ni, Tc and Mn. The interaction between Z and X is shown in Supplementary Figure 16, which has been improved with TM = Ru, Os, Ni and Rh.
The summary of the linear compressibility of the TM-LFP models is shown in Supplementary Figure 17, in which the yellow area indicates the models with higher linear compressibility than pure LFP and X, Y and Z indicate the directions of particular TM-LFP models. The summary of the shear strength of the TM-LFP models is shown in Supplementary Figure 18, in which the green area indicates the models with higher shear strength than pure LFP and the XY, YZ and ZX indicate the directions of particular TM-LFP models.
Compared with pure LFP, the stability of Sc-, Ti-, Cu-, Y-, Zr-, Nb-, Pd-, Ag-, Cd-, La-, Hf-, Re-, Pt-, Au- and Hg-doped LFP decreased, as shown in the white area of Figure 4C. This may be because the valence electron structures of these TM atoms differ greatly from Fe. For linear compressibility, V-, Cr-, Co-, Ni-, Zn-, Mo-, Ru-, Ta-, W-, Os- and Ir-doped LFP are greater than that of pure LFP, indicating an increase in linear compressibility after doping, as shown in the yellow and blue areas of Figure 4C. For shear strength, Mn-, Co-, Ni-, Zn-, Ru-, Rh-, Ta-, Os- and Ir-doped LFP are greater than that of pure LFP, indicating an increase in shear strength after doping, as shown in the green and blue areas of Figure 4C.
It is noteworthy that for Co-, Ni-, Zn-, Ru-, Ta-, Os- and Ir-doped LFP, compared with pure LFP, both their linear compressibility and shear intensity increase. Therefore, for LIBs, they can be considered as promising dopants for LFP, as shown in the blue area of Figure 4C. Through the above analysis, considering the linear compressibility and shear strength of the TM-LFP models, the three TM-doped LFP models with the best elastic performance are Os-LFP, Ru-LFP and Ni-LFP, as shown in the right-bottom corner of Figure 4C.
Screening for TM-LFP models with higher isotropy
According to relevant experimental reports, after dozens of charge and discharge cycles, cracks appear in pure and doped LFP[33,34]. The appearance of cracks plays a very important role in the attenuation of the electrochemical properties of the electrode material, which is closely related to the anisotropy of the electrodes[56-59]. The more anisotropic an electrode material is, the more likely it is to cause changes in its own structure during cycling, resulting in cracks on the surface of the electrode particles. Therefore, screening electrode materials with high isotropy is beneficial in reducing the occurrence of cracks in the circulation of electrode materials. The anisotropy of the shear modulus for orthorhombic lattices is presented in Equations (6-8) as follows:
A1 = 4c44/(c11 + c33 - 2c13) (6)
A2 = 4c55/(c22 + c33 - 2c23) (7)
A1 = 4c66/(c11 + c22 - 2c12) (8)
where A1, A2 and A3 represent the anisotropy shear moduli of the <010> and <011> directions of {100} planes, the <001> and <100> directions of {010} planes and the <110> and <010> directions of {001} planes, respectively. The calculated results of anisotropy shear moduli of all the TM-LFP models are shown in Supplementary Table 51. It is noteworthy that the deviation of Ai from 1 shows the degree of anisotropy, shown in Figure 5A, and the value of Ai close to 1 indicates the extent of isotropy for a particular material, shown in Figure 5B. The above-described adjustment of anisotropy can be achieved by the selective doping of Fe sites in LFP.
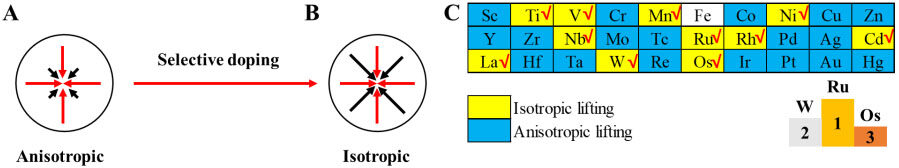
Figure 5. Screening for higher isotropy of TM-LFP. Models of (A) anisotropy (before doping) and (B) isotropy (after selective doping). (C) Anisotropies of TM-LFP compared with LFP.
The anisotropy shear moduli of the <010> and <011> directions of the {100} planes (A1) of the TM-LFP models are shown in Supplementary Figure 19, in which the corresponding anisotropy of Ru-LFP, Ir-LFP and Os-LFP models is minimal. The anisotropy shear moduli of the <001> and <100> directions of the {010} planes (A2) of the TM-LFP models are shown in Supplementary Figure 20, in which the corresponding anisotropy of Mn-LFP, W-LFP and La-LFP is minimal. The anisotropy shear moduli of the <110> and <010> directions of the {001} planes are shown in Supplementary Figure 21, in which the corresponding anisotropy of Cr-LFP, Ru-LFP and La-LFP is minimal.
In this work, the anisotropy (A) of a particular material is obtained by summing Ai in three different directions, as shown in Equation (9):

where i = 1, 2 or 3. To compare the isotropy of models of different TM-doped LFP models (ATM) with the anisotropy of the LFP itself (ALFP), we use the difference (ITM) between the two models as an indicator, which can be calculated by Equation (10):
ITM = ALFP-ATM (10)
where ITM < 0 indicates a model with higher anisotropy than pure LFP. Our aim is to find TM-doped LFP models with reduced anisotropy (ITM > 0). Based on the comprehensive consideration of the calculated Ai, the doping effect of TMs on the anisotropy of LFP is summarized in Figure 5C and Supplementary Figure 22. The isotropy of LFP is enhanced by the doping of Ti, V, Mn, Ni, Nb, Ru, Rh, Cd, La, W and Os, as shown in the yellow area of Figure 5C, while other TMs are not, as shown in the blue area of Figure 5C. The increase of isotropy will reduce the possibility of cracks to a certain extent, which plays an important role in improving electrochemical properties. Through the above analysis and Supplementary Figure 22, the three TM-doped LFP models with the highest isotropic properties are Ru-LFP, W-LFP and Os-LFP, as shown in the right-bottom corner of Figure 5C.
Screening for higher operating voltages
High-voltage LIBs will have a larger market space in the future due to their higher energy density, and increasing the operating voltage of the cathode material has a positive significance for increasing the operating voltage of LIBs. The lithiation/delithiation voltage (U) of TM-LFP cathodes can be calculated by Equation (11):

In order to increase the operating voltage of LFP by TM doping, the lithiation/delithiation voltages of all the 3d, 4d and 5d TM-doped LFP models are calculated, as shown in Figure 6A and Supplementary Table 52. By selectively doping TMs in LFP, significant lithiation/delithiation voltage increases (especially greater than 4V) can be seen, as shown in the Supplementary Figure 23 and the yellow area of Figure 6A. In order to analyze the effect of the doping of different TM elements more clearly on the lithiation/delithiation voltage of LFP, we divided the voltage range into three parts with 3 and 4 V, as shown in Figure 6B. The red area in Figure 6B donates the TM-LFP models with lithiation/delithiation voltages theoretically lower than 3.0 V, which will not be considered in the further analysis due to the relatively smaller voltage. In the white region of Figure 6A, the lithiation/delithiation voltage corresponding to the doped LFP model with five TMs theoretically exceeds 4 V, which has the advantage of increasing the LFP voltage significantly. The three TM-doped LFP models with the highest lithiation/delithiation are Ag-LFP, Cu-LFP and Pd-LFP, as shown in the right-bottom corner of Figure 6B.
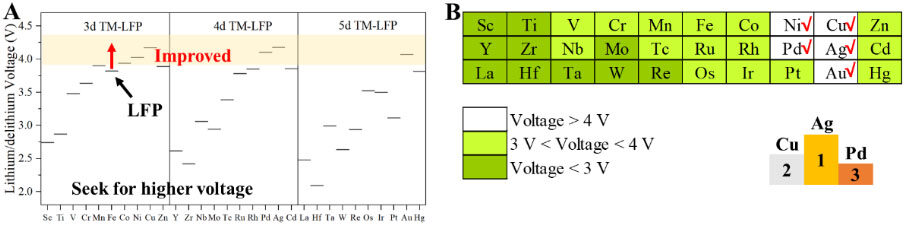
Figure 6. Screening for higher operating voltages. A: Lithiation/delithiation voltages of TM-LFP and LFP, where the white area shows the corresponding models with higher lithiation/delithiation voltages compared with LFP. B: Classification of lithiation/delithiation voltages of TM-LFP and LFP, where the darker the color, the higher the lithiation/delithiation voltages. LFP: LiFePO4.
Suitable TM doping for LFP
In fact, when screening the models of TM-doped LFP, multiple factors need to be considered simultaneously rather than individually. In order to identify the TM-LFP cathode materials with excellent performance, through the analysis of the previous six parts, we established the screening criteria shown in Table 1 in this work. Finally, based on the above screening criteria, we analyzed 30 TM-LFP models and the results are shown in Figures 7 and 8. Overall, the V-, Mn-, Ni-, Rh- and Os-doped LFP models show relatively excellent electrochemical performance, which meets the above screening criteria. It is noteworthy that the V-LFP model is the easiest to form and has a minimal band gap. In contrast, Ni-LFP has the highest lithiation/delithiation voltage.
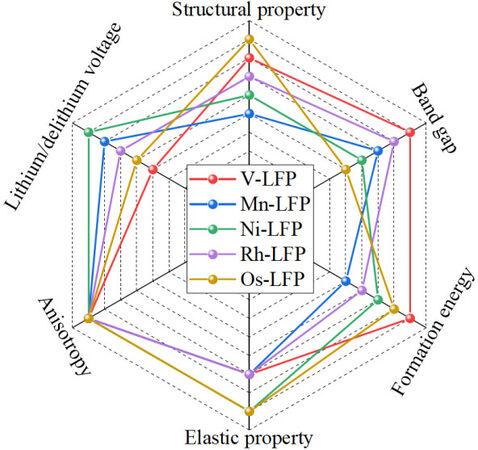
Figure 7. Radar diagram of TM-doped LFP models with excellent electrochemical performance screened from a comparison of the six screen standards. LFP: LiFePO4.
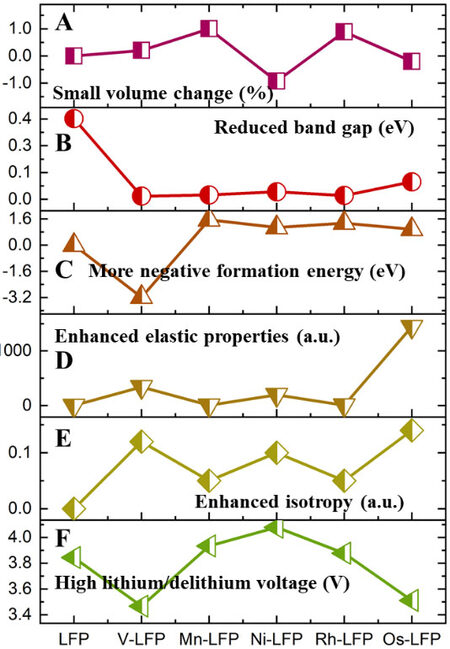
Figure 8. Performance comparison of five TM-LFP models with excellent electrochemical properties based on the screening criteria in this work. A: Cell volume change. B: Band gap. C: Dopant formation energy. D: Elastic properties (including linear compressibility and shear strength). E: Isotropy. F: Lithiation/delithiation voltage. LFP: LiFePO4.
Screening criteria for TM-LFP models in this work
| No. | Items | Screening criteria |
| (1) | Cell volume change | Less than 2% compared with LFP |
| (2) | Band gap | Less than 0.1 eV |
| (3) | Doping formation energy | Less than 2 eV |
| (4) | Linear compressibility and shear strength | Both linear compressibility and shear strength higher than LFP |
| (5) | Isotropy | Higher than LFP |
| (6) | Lithiation/delithiation voltage | Higher than 3 eV |
CONCLUSIONS
Although LFP is one of the most attractive cathode materials for lithium-ion batteries, the large-scale applications of LFP have been limited by its relatively low electronic and ionic conductivity. It is an effective strategy to improve the electronic and ionic conductivity electrode materials by doping. In this work, in order to compare the electrochemical properties of 3d, 4d and 5d transition metal-doped LFP (TM-LFP), we used the method of first-principles calculations to theoretically analyze all doped structures from the perspectives of structural properties, band gaps, formation energy, elastic properties, anisotropy and lithiation/delithiation voltage. According to our screening results, the V-, Mn-, Ni-, Rh- and Os-doped LFP structures have good electrochemical properties and can be used as cathode materials for LIBs. Moreover, the reasons for the inherent principle of the above materials showing excellent electrochemical properties are presented.
DECLARATIONS
Authors’ contributionsConception of the study and wrote the manuscript: Zhang B, Wang X, He X
Material support: He Y, Liu J
Data analysis and technical support: Zhang B, He Y, Gao H
Performed experience and data acquisition: Zhang B, Gao H, Xu H, He X
Availability of data and materialsNot applicable.
Financial support and sponsorshipWe would like to show gratitude to the National Natural Science Foundation of China (No. U21A20170 (X. He), 52007099 (D. Ren), 22175106 (Y. Yang) and 52073161 (H. Xu)), the Ministry of Science and Technology of China (No. 2019YFE0100200 (X. He) and 2019YFA0705703 (L. Wang)) and China Postdoctoral Science Foundation (No.2021M701873 (B. Zhang)). The authors also thank Tsinghua University-Zhangjiagang Joint Institute for Hydrogen Energy and Lithium-Ion Battery Technology.
Conflicts of interestAll authors declared that there are no conflicts of interest.
Ethical approval and consent to participateNot applicable.
Copyright© The Author(s) 2022.
Supplementary MaterialsREFERENCES
1. Padhi AK, Nanjundaswamy KS, Goodenough JB. Phospho-olivines as positive-electrode materials for rechargeable lithium batteries. J Electrochem Soc 1997;144:1188-94.
2. Q; Advanced Batteries and Materials Engineering Research Center, Guizhou Light Industry Technical College, Guiyang 550025, China. Combined first-principles and experimental studies of a V- doped LiFePO4/C composite as a cathode material for lithium-ion batteries. Int J Electrochem Sci 2021; doi: 10.20964/2021.05.01.
3. Zhang X, Ge X, Shen Z, et al. Green water-based binders for LiFePO 4 /C cathodes in Li-ion batteries: a comparative study. New J Chem 2021;45:9846-55.
4. Wang Y, Zhang J, Xue J, Ke X, Liang G. LiFePO4/C composites with high compaction density as cathode materials for lithium-ion batteries with high volumetric energy density. Ionics 2021;27:4687-94.
5. Song Y, Xie B, Song S, et al. Regeneration of LiFePO 4 from spent lithium-ion batteries via a facile process featuring acid leaching and hydrothermal synthesis. Green Chem 2021;23:3963-71.
6. Huang X, He X, Jiang C, Tian G, Liu Y. Reaction mechanisms on solvothermal synthesis of nano LiFePO4 crystals and defect analysis. Ind Eng Chem Res 2017;56:10648-57.
7. Garay-marín JD, Quiroga-gonzález E, Garza-tovar LL, et al. High-performing li-ion battery with “two cathodes in one” of sulfur and LiFePO4 by strategies of mitigation of polysulfide shuttling. Batteries & Supercaps 2021;4:359-67.
8. Cui Z, Guo X, Ren J, et al. Enhanced electrochemical performance and storage mechanism of LiFePO4 doped by Co, Mn and S elements for lithium-ion batteries. Electrochimica Acta 2021;388:138592.
9. Cheng Q, Zhao X, Yang G, et al. Recent advances of metal phosphates-based electrodes for high-performance metal ion batteries. Energy Stor Mater 2021;41:842-82.
10. Zhong Z, Chen L, Zhu C, Ren W, Kong L, Wan Y. Nano LiFePO4 coated Ni rich composite as cathode for lithium ion batteries with high thermal ability and excellent cycling performance. J Power Sources 2020;464:228235.
11. Nie Z, Liu Y, Yang L, Li S, Pan F. Construction and application of materials knowledge graph based on author disambiguation: revisiting the evolution of LiFePO4. Adv Energy Mater 2021;11:2003580.
12. Sifuba S, Willenberg S, Feleni U, Ross N, Iwuoha E, Khabashesku V. Electrochemical analysis of architecturally enhanced LiFe0.5Mn0.5PO4 multiwalled carbon nanotube composite. J Nanotechnol 2021;2021:1-8.
13. Sifuba S, Willenberg S, Feleni U, Ross N, Iwuoha E. Electrochemical analysis of architecturally enhanced LiFe0.5Mn0.5PO4 multi-walled carbon nanotube composite. JNanoR 2021;66:1-11.
14. Adepoju AA, Williams QL. High C-rate performance of LiFePO4/carbon nanofibers composite cathode for Li-ion batteries. Curr Appl Phys 2020;20:1-4.
15. Bazzi K, Dhindsa KS, Dixit A, et al. Nanostructured high specific capacity C-LiFePO4 cathode material for lithium-ion batteries. J Mater Res 2012;27:424-30.
16. Tian X, Chen W, Jiang Z, Jiang Z. Porous carbon-coated LiFePO4 nanocrystals prepared by in situ plasma-assisted pyrolysis as superior cathode materials for lithium ion batteries. Ionics 2020;26:2715-26.
17. Wang C, Yuan X, Tan H, et al. Three-dimensional carbon-coated LiFePO4 cathode with improved li-ion battery performance. Coatings 2021;11:1137.
18. Yang G, Jiang CY, He XM, Ying JR, Gao J. Preparation of Li3V2 (PO4)3/LiFePO4 composite cathode material for lithium ion batteries. Ionics 2013;19:1247-53.
19. Ren J, Pu W, He X, Jiang C, Wan C. A carbon-LiFePO4 nanocomposite as high-performance cathode material for lithium-ion batteries. Ionics 2011;17:581-6.
20. Gao J, Li JJ, He XM, Jiang CY, Wan CR. Synthesis and electrochemical characteristics of LiFePO4/C cathode materials from different precursors. Int J Electrochem Sci 2011;6(7):2818-2825. Available from:
21. Gao Y, Xiong K, Zhang H, Zhu B. Effect of Ru doping on the properties of LiFePO4/C cathode materials for lithium-ion batteries. ACS Omega 2021;6:14122-9.
22. Liu Z, Huang X, Wang D. First-principle investigations of N doping in LiFePO4. Solid State Commun 2008;147:505-9.
23. Yolun A, Altin E, Altundag S, Arshad M, Abbas SM, Altin S. Investigation of structural and electrochemical performance of Ru-substituted LiFePO4 cathode material: an improvement of the capacity and rate performance. J Mater Sci: Mater Electron 2022;33:6670-80.
24. Zhang L, Zeng D. Aluminium behaviour in preparation process of lithium iron phosphate and its effects on material electrochemical performance. J Mater Res Technol 2021;15:3575-84.
26. Li JG, Zhao PX, Duan WL, Wang L, Li JJ, He XM. Hydrothermal synthesis of well-dispersed LiMn0.7Fe0.3PO4/C nanocrystalline cathodes for lithium-ion batteries. Int J Electrochem Sci 2015;10(9):7371-7379. Available from:
27. Ye F, Wang L, He X, et al. Solvothermal synthesis of nano LiMn0.9Fe0.1PO4: reaction mechanism and electrochemical properties. J Power Sources 2014;253:143-9.
28. Yang G, Jiang C, He X, Ying J, Cai F. Preparation of V-LiFePO4 cathode material for Li-ion batteries. Ionics 2012;18:59-64.
29. Wang L, Zhang LW, Li JJ, Gao J, Jiang CY, He XM. First-principles study of doping in LiMnPO4. Int J Electrochem Sci 2012;7(4):3362-3370. Available from:
30. Ying J, Lei M, Jiang C, et al. Preparation and characterization of high-density spherical Li0.97Cr0.01FePO4/C cathode material for lithium ion batteries. J Power Sources 2006;158:543-9.
31. Trinh DV, Nguyen MTT, Dang HTM, et al. Hydrothermally synthesized nanostructured LiMnxFe1-xPO4 (x = 0-0.3) cathode materials with enhanced properties for lithium-ion batteries. Sci Rep 2021;11:12280.
32. Zhang D, Wang J, Dong K, Hao A. First principles investigation on the elastic and electronic properties of Mn, Co, Nb, Mo doped LiFePO4. Comput Mater Sci 2018;155:410-5.
33. Wang D, Wu X, Wang Z, Chen L. Cracking causing cyclic instability of LiFePO4 cathode material. J Power Sources 2005;140:125-8.
34. Maxisch T, Ceder G. Elastic properties of olivine LixFePO4 from first principles. Phys Rev B 2006:73.
35. Kobayashi H, Shigemura H, Tabuchi M, et al. Electrochemical properties of hydrothermally obtained LiCo[sub 1−x]Fe[sub x]O[sub 2] as a positive electrode material for rechargeable lithium batteries. J Electrochem Soc 2000;147:960.
36. Needham S, Wang G, Liu H, Drozd V, Liu R. Synthesis and electrochemical performance of doped LiCoO2 materials. J Power Sources 2007;174:828-31.
37. Kresse G, Furthmüller J. Efficient iterative schemes for ab initio total-energy calculations using a plane-wave basis set. Phys Rev B Condens Matter 1996;54:11169-86.
38. Hafner J. Ab-initio simulations of materials using VASP: density-functional theory and beyond. J Comput Chem 2008;29:2044-78.
39. Perdew JP, Burke K, Ernzerhof M. Generalized Gradient Approximation Made Simple. Phys Rev Lett 1996;77:3865-8.
40. Barma M. Gaussian smearing of spin weight functions in models of phase transitions. J Phys A: Math Gen 1983;16:L745-50.
41. Yang L, Tian Y, Chen J, et al. A high-rate capability LiFePO4 /C cathode achieved by the modulation of the band structures. J Mater Chem A 2021;9:24686-94.
42. Avilov A, Lepeshov G, Pietsch U, Tsirelson V. Multipole analysis of the electron density and electrostatic potential in germanium by high-resolution electron diffraction. J Phys Chem Solids 2001;62:2135-42.
43. Shi S, Liu L, Ouyang C, et al. Enhancement of electronic conductivity of LiFePO4 by Cr doping and its identification by first-principles calculations. Phys Rev B 2003:68.
44. Zhang B, Peng Z, Song L, Wu X, Fu X. Computational screening toward quantum capacitance of transition-metals and vacancy doped/co-doped graphene as electrode of supercapacitors. Electrochimica Acta 2021;385:138432.
45. Zhang B, Fu X, Song L, Wu X. Computational screening toward hydrogen evolution reaction by the introduction of point defects at the edges of group IVA monochalcogenides: a first-principles study. J Phys Chem Lett 2020;11:7664-71.
46. Xu CH, Wang L, He XM, Luo J, Shang YM, Wang JL. Formation mechanism and growth habit of olivine-LiFePO4 materials by hydrothermal synthesis. Int J Electrochem Sci 2016;11(2):1558-1567. Available from:
47. de Walle CG, Neugebauer J. First-principles calculations for defects and impurities: Applications to III-nitrides. Journal of Applied Physics 2004;95:3851-79.
48. Ko M, Chae S, Jeong S, Oh P, Cho J. Elastic a-silicon nanoparticle backboned graphene hybrid as a self-compacting anode for high-rate lithium ion batteries. ACS Nano 2014;8:8591-9.
49. Chang B, Kim J, Cho Y, et al. Highly elastic binder for improved cyclability of nickel-rich layered cathode materials in lithium-ion batteries. Adv Energy Mater 2020;10:2001069.
50. Zhang W, Hu J, Guo Y, et al. Tin-nanoparticles encapsulated in elastic hollow carbon spheres for high-performance anode material in lithium-ion batteries. Adv Mater 2008;20:1160-5.
51. Chen Y, Wang L, Anwar T, et al. Application of galvanostatic intermittent titration technique to investigate phase transformation of LiFePO4 nanoparticles. Electrochimica Acta 2017;241:132-40.
52. Zhang B, Fu X, Song L, Wu X. Surface selectivity of Ni3S2 toward hydrogen evolution reaction: a first-principles study. Phys Chem Chem Phys 2020;22:25685-94.
53. Güler E, Güler M, Uğur Ş, Uğur G. DFT aspects of the elastic, mechanical, magnetic, thermodynamic and optical properties of Ce 3 XY perovskites. Philos Mag 2022;102:244-63.
54. Khanzadeh M, Alahyarizadeh G. A DFT study on pressure dependency of TiC and ZrC properties: interconnecting elastic constants, thermodynamic, and mechanical properties. Ceram Int 2021;47:9990-10005.
55. Chibani S, Chami N, Arbouche O, Amara K, Kafi A. Structural, elastic, electronic and transport properties of CoVX (X = Ge and Si) compounds: a DFT prediction. Computational Condensed Matter 2020;24:e00475.
56. Hashigami S, Kato Y, Yoshimi K, et al. Effect of lithium silicate addition on the microstructure and crack formation of LiNi0.8Co0.1Mn0.1O2 cathode particles. ACS Appl Mater Interfaces 2019;11:39910-20.
57. Trevisanello E, Ruess R, Conforto G, Richter FH, Janek J. Polycrystalline and single crystalline NCM cathode materials-quantifying particle cracking, active surface area, and lithium diffusion. Adv Energy Mater 2021;11:2003400.
58. Pang P, Tan X, Wang Z, et al. Crack-free single-crystal LiNi0.83Co0.10Mn0.07O2 as cycling/thermal stable cathode materials for high-voltage lithium-ion batteries. Electrochimica Acta 2021;365:137380.
Cite This Article
Export citation file: BibTeX | RIS
OAE Style
Zhang B, He Y, Gao H, Wang X, Liu J, Xu H, Wang L, He X. Unraveling the doping mechanisms in lithium iron phosphate. Energy Mater 2022;2:200013. http://dx.doi.org/10.20517/energymater.2022.12
AMA Style
Zhang B, He Y, Gao H, Wang X, Liu J, Xu H, Wang L, He X. Unraveling the doping mechanisms in lithium iron phosphate. Energy Materials. 2022; 2(2): 200013. http://dx.doi.org/10.20517/energymater.2022.12
Chicago/Turabian Style
Zhang, Bo, Yufang He, Hongqiang Gao, Xiaodan Wang, Jinli Liu, Hong Xu, Li Wang, Xiangming He. 2022. "Unraveling the doping mechanisms in lithium iron phosphate" Energy Materials. 2, no.2: 200013. http://dx.doi.org/10.20517/energymater.2022.12
ACS Style
Zhang, B.; He Y.; Gao H.; Wang X.; Liu J.; Xu H.; Wang L.; He X. Unraveling the doping mechanisms in lithium iron phosphate. Energy Mater. 2022, 2, 200013. http://dx.doi.org/10.20517/energymater.2022.12
About This Article
Copyright

Data & Comments
Data


 Cite This Article 35 clicks

 Like This Article 16
likes
Like This Article 16
likes


Comments
Comments must be written in English. Spam, offensive content, impersonation, and private information will not be permitted. If any comment is reported and identified as inappropriate content by OAE staff, the comment will be removed without notice. If you have any queries or need any help, please contact us at support@oaepublish.com.