
Dealloying-derived Fe-doped Ni(OH)2/Ni foils as self-supported oxygen evolution reaction catalysts

Abstract
Dealloying has been an essential technique for developing nanostructured catalysts for the oxygen evolution reaction (OER). Self-supported active catalysts can be fabricated through an alloying-dealloying process on metal foil surfaces. This study uses a Ga-assisted alloying-dealloying strategy combined with electrooxidation and heteroatom doping to fabricate a Fe-doped Ni(OH)2/Ni self-supported OER catalyst. We find that the surface phase compositions and dealloyed structures can be adjusted by controlling the reaction-diffusion temperature and time. The optimized O-Ni-Fe/200-3 catalyst shows an overpotential of 318 mV to activate a 10 mA cm-2 current density with a Tafel slope of 60.60 mV dec-1. Ex-situ characterization of the catalyst proves that Fe doping promotes the formation of active NiOOH, which contributes to the excellent OER activity. This study extends the Ga-assisted alloying-dealloying strategy and demonstrates the possibility of controlling the microstructure of dealloyed materials by changing the reaction-diffusion conditions.
Keywords
INTRODUCTION
Hydrogen (H2) is an eco-friendly energy source with a high gravimetric energy density that is vital for a low-carbon future. Electrochemical water splitting is a promising and efficient technique to transform electricity into H2. In the electrochemical water-splitting process, high-efficiency catalysts are necessary to promote the energy conversion rate of H2 production[1,2]. In particular, in the anodic process, the oxygen evolution reaction (OER) suffers from sluggish kinetics, which results in massive electricity consumption to produce H2[3]. Noble metal catalysts, such as Pt, Ru, Ir, and their compounds, have been commercially utilized to increase the electrocatalytic efficiency[4-7].
The search for catalysts from earth-abundant elements, especially those from the first row of 3d transition metals, has attracted significant attention from researchers. Ni, Co, Fe, and Mn-based materials, e.g., alloys[8,9], oxides[10-12], (oxy)hydroxides[3,13,14], and chalcogenides[15,16], are among the most promising candidates for catalyzing the OER. Among them, NiFe-based (oxy)hydroxides have the potential to be industrialized due to the abundant reserves of Ni and Fe elements[3,9]. Substantial efforts have been made to study the catalytic mechanisms and enhance the performance of such NiFe-based (oxy)hydroxides, especially to investigate the role of Fe doping in Ni-based materials. For instance, Trotochaud et al. found that via coprecipitation with Fe, the conductivity of Ni (oxy)hydroxides increased distinctly and the Fe impurities were responsible for the improved activity of aged Ni (oxy)hydroxides[14]. Friebel et al. stressed the importance of the Fe3+ cation in the OER performance of γ-Ni1-xFexOOH as they act as the active sites in γ-Ni1-xFexOOH instead of Ni3+[17]. Zhang et al. observed the transformation of Fe2O3-Ni(OH)2 to
Generally, powdery catalysts are only synthesized for lab-scale studies. Binders and carbon powders are necessary when preparing the catalyst ink for the OER test, which affects the proper assessment of the catalytic performance[4]. In contrast, a self-supported electrode can avoid such issues. Ni foams or foils have been extensively used as supporting substrates for oxygen/hydrogen evolution reaction catalysts[21]. Through a hydro/solvothermal, chemical vapor deposition, or electrodeposition method, metal (oxy)hydroxides can be grown on a Ni substrate as self-supported catalysts[22-25]. In addition, anodization is also a powerful technique to modify the surface properties of Ni foam or foil. By applying an anodization potential of 50 V in oxalate acid, C-doped NiO was formed on the Ni foam surface with excellent activity[26]. Surface alloying/dealloying offers another opportunity to generate active sites on free-standing Ni. Dealloying is generally used as a top-down strategy to fabricate nanoporous metals. Though the dealloyed metals are mostly powdery, self-standing dealloyed materials can be achieved using metallic glasses as precursors[27,28]. Recently, our group proposed a liquid metal Ga-assisted alloying/dealloying method to transform the surface of metal foils, e.g., Ni, Co, Cu, Au, and Ag, into a nanostructured layer[29,30]. In this method, the alloying process is controlled by the reaction diffusion between metals, and the compositions and structures of the dealloyed metals can be adjusted by optimizing the dealloying process and post-treatment.
Herein, a Ga-assisted alloying/dealloying method combined with post-electrooxidation is applied to form a Fe-doped Ni(OH)2/Ni foil. The alloying process of Ga and Ni is studied by controlling the heat treatment temperature and time. Different Ga-Ni phase compositions and alloying depths are obtained by changing the temperature and time. A Ni columnar array structure is formed after dealloying the Ga-Ni alloy layer in a 0.2 or 2 M NaOH solution. Further electrooxidation of the dealloyed foils in a Fe3+-containing alkaline electrolyte results in the formation of an Fe-doped Ni(OH)2 layer on the surface. The as-fabricated catalysts are self-supporting and have good performance in OER catalysis. The optimized Fe-doped Ni(OH)2/Ni foils deliver an overpotential of 318 mV at 10 mA cm-2 and long durability of at least 10 h.
EXPERIMENTAL
Preparation of nanostructured nickel foil
Ni foils (99.9 wt.%) were cleaned by soaking in a 1 wt.% HCl solution for 30 min, followed by washing with deionized water and alcohol at least 3 times. A certain amount of Ga ingot (99.99 wt.%) was placed on a hotplate at 50 °C to maintain the liquid state. A paintbrush was used to brush liquid Ga onto the dried Ni foil, which was then annealed in a vacuum to form Ga-Ni alloys via reaction diffusion. The amount of painted Ga was measured as ~8.9 mg cm-2. The annealing was controlled at 150, 200, and 250 °C for 3 h to study the effect of temperature on the reaction-diffusion process. The effect of annealing time was also investigated by maintaining the annealing at 200 °C for 1, 3, and 6 h. The samples were labeled as Ga-Ni/X-Y, where X and Y refer to the temperature and time, respectively, e.g., Ga-Ni/200-3 was obtained by annealing the foil at 200 °C for 3 h. The prepared alloy foil was dealloyed in a 2 M NaOH solution at 80 °C until no bubbles appeared. The dealloyed Ni foil, labeled as D-Ni/X-Y following the above naming rule, was washed and dried in a vacuum at room temperature. The D-Ni/200-3 foil was then electrooxidized in a 0.1 M KOH solution using repeated cyclic voltammetry (CV) between 1 and 2 V vs. a reversible hydrogen electrode (RHE) for 50 cycles at 50 mV s-1 to obtain O-Ni/200-3. The Fe-doped sample (O-Ni-Fe/200-3) was achieved via electrooxidation of the D-Ni/200-3 foil in a 0.1 M KOH solution containing 0.1 M
Characterization of catalysts
The phase compositions of the samples were investigated by X-ray diffraction (XRD, PANalytical X’pert Pro). A field-emission scanning electron microscope (SEM, Zeiss Sigma 500) and transmission electron microscope (TEM, FEI Tecnai G2 F20) were used to obtain the microstructures of the samples. Selected area electron diffraction (SAED), high-resolution transmission electron microscopy (HRTEM), and scanning transmission electron microscopy-energy dispersive spectroscopy (EDS) mapping were also used to study the nature of the crystallinity and composition of the samples. X-ray photoelectron spectroscopy (XPS, Thermo Scientific) was used to characterize the surface element states of the samples using monochromatic Al Kα radiation.
Electrochemical measurements
A three-electrode cell was used for the electrochemical measurements on a Bio-Logic SP-240 electrochemical workstation. The as-synthesized Ni foils were used as the working electrode (0.5 × 0.5 cm2). The counter and reference electrodes were graphite rod and Ag/AgCl (saturated KCl filled), respectively. All potentials measured were converted to the RHE scale, according to E (vs. RHE) = E (vs. Ag/AgCl) + 0.0591 pH + 0.197.
The linear sweep voltammetry (LSV) curves were carried out in an O2-saturated 1.0 M KOH electrolyte with a sweep rate of 5 mV s-1. All LSV curves were iR-compensated to exclude the influence of the solution resistance. CV curves were recorded at 0.0-0.6 V vs. Ag/AgCl with various sweep rates to analyze the number of active sites. Electrochemical impedance spectroscopy (EIS) was conducted on the same electrolyte from 106 to 0.1 Hz at 0.6 V vs. Ag/AgCl at 1600 rpm with an excitation voltage of 5 mV.
Results and discussion
The Ni foils with a nanostructured layer on the surface were obtained from a facile Ga painting-alloying-dealloying strategy[30], as illustrated in Scheme 1. After painting Ga on the surface of the Ni foil, the subsequent annealing treatment promoted the reaction diffusion between Ga and Ni. The XRD patterns in Supplementary Figure 1 display the phase composition before annealing, where the Ga (PDF #05-0601) and Ni phases (PDF #04-0850) can be observed. The reaction diffusion may generate various Ga-Ni phases by adjusting the annealing temperature and time. Based on this assumption, we annealed the Ga-painted Ni foil at 150, 200, and 250 °C for 3 h and at 200 °C for 1, 3, and 6 h to demonstrate the change in phase compositions. The XRD patterns in Figure 1A exhibit that, after being annealed at 150 °C for 3 h, Ga4Ni (PDF #37-1095) and Ni (PDF #04-0850) phases are found on the foil, indicating that all the Ga was transformed into the Ga4Ni alloy.
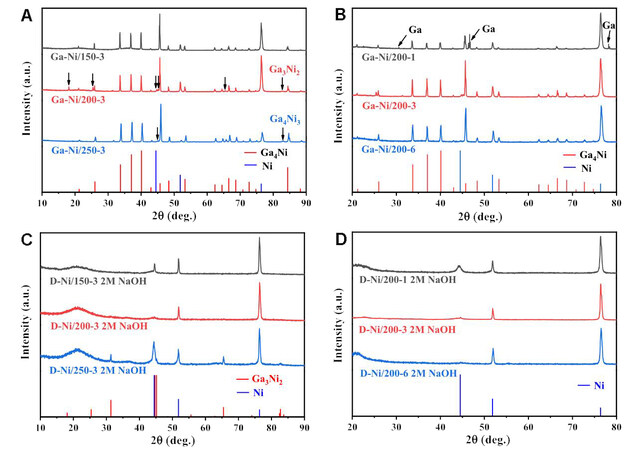
Figure 1. XRD patterns of (A) Ga-Ni alloy foil annealed at 150, 200, and 250 °C for 3 h, (B) Ga-Ni alloy foil annealed at 200 °C for 1, 3, and 6 h and dealloyed Ga-Ni alloy foil in 2 M NaOH, (C) D-Ni/150-3, D-Ni/200-3 and D-Ni/250-3 and (D) D-Ni/200-1, D-Ni/200-3 and D-Ni/200-6. XRD: X-ray diffraction.
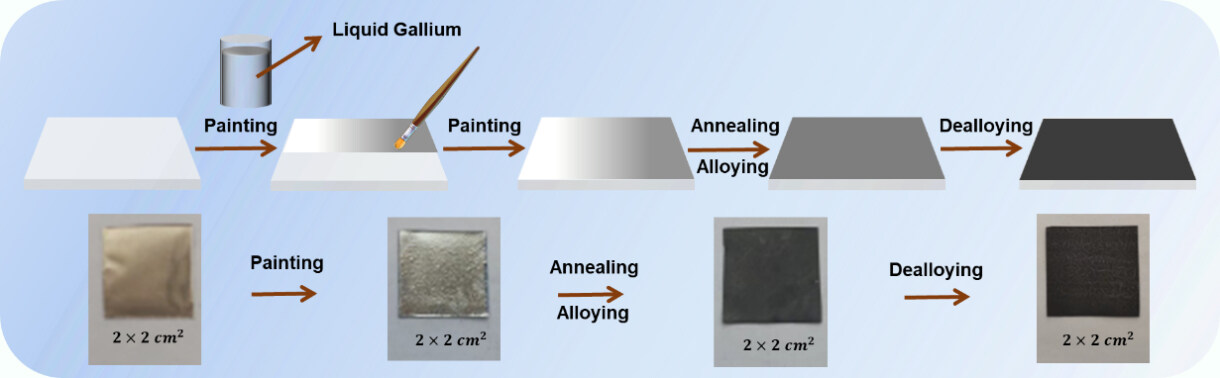
Scheme 1. Schematic illustration and photographs showing the fabrication process for the dealloyed foil.
Increasing the annealing temperature leads to impurity phases, such as Ga3Ni2 (PDF #65-7366) at 200 °C and Ga4Ni3 (PDF # 65-9741) at 250 °C for 3 h. The atomic ratio of Ga to Ni is 1.50 for Ga3Ni2 and 1.33 for
As previously reported, the Ga-X (X = Co or Ni) alloys could be dealloyed in NaOH solutions[30,31]. Herein, we applied 2 M NaOH as the dealloying electrolyte. The phase compositions of the as-dealloyed samples are exhibited in Figure 1C and D. Both the D-Ni/150-3 and D-Ni/200-3 samples were fully dealloyed with only the Ni phase retained. While for D-Ni/250-3, the Ga3Ni2 phase could still be detected after dealloying. However, the Ga-Ni alloy layer can be dealloyed entirely for the samples annealed at 200 °C for 1, 3, and even 6 h. The annealing temperature influences the phase compositions, which may further affect the microstructure after dealloying. As shown in Figure 2A-C, a cubic structure with an edge length of ~2 μm was obtained for the D-Ni/150-3 sample. D-Ni/200-3 and D-Ni/250-3 show columnar arrays after being dealloyed in 2 M NaOH. The thickness of the dealloyed layer is measured as ~5.5 μm for D-Ni/200-3
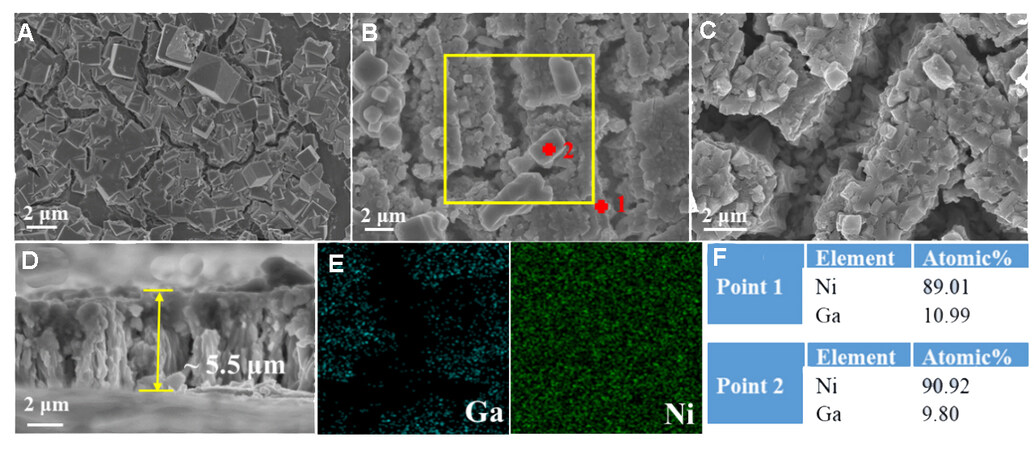
Figure 2. Surface microstructures of (A) D-Ni/150-3, (B) D-Ni/200-3, and (C) D-Ni/250-3 dealloyed in 2 M NaOH. (D) Cross-section view of D-Ni/200-3. (E) EDS elemental distribution corresponding to the yellow square area in (B). (F) Elemental ratios obtained from EDS point scan corresponding to points 1 and 2 in (B). EDS: Energy dispersive spectroscopy.
The electrolytes, dealloying time, and temperature affect the dealloying behavior and structural features of the dealloyed metals[32]. To evaluate the influence of the concentration of the dealloying electrolyte, we also used a 0.2 M NaOH solution as the dealloying electrolyte. Only D-Ni/150-3 can be fully dealloyed in such a dilute alkaline solution, while the Ga4Ni phase was retained after dealloying the D-Ni/200-3 sample, and both Ga4Ni and Ga3Ni2 were detected for the D-Ni/250-3 sample [Supplementary Figure 5]. Similar structures were found from the samples after dealloying in 0.2 M NaOH [Supplementary Figure 6A-C]. Furthermore, the EDS elemental distribution mapping displays almost only Ni in the D-Ni/150-3 sample
An electrooxidation method via CV cycling was applied to generate an OER active Ni(OH)2 layer on the
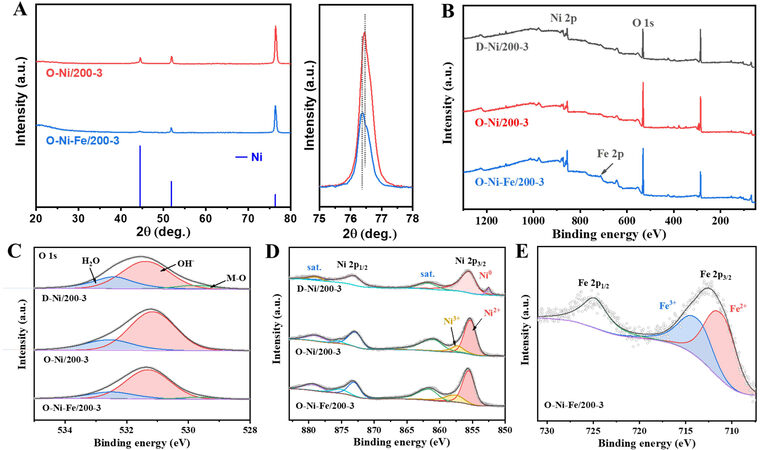
Figure 3. (A) XRD patterns of O-Ni/200-3 and O-Ni-Fe/200-3 and the magnified patterns corresponding to the region at 75°-78°
The surface chemical states of the catalysts were analyzed through XPS. The full-scan survey reveals the presence of Ni and O in D-Ni/200-3 and O-Ni/200-3, with Fe also observed in the O-Ni-Fe/200-3 sample [Figure 3B]. From the XPS survey [Supplementary Table 1], the surface atomic concentration ratio of Fe to Ni is estimated to be 0.32. If we assume that all Ni exists in Ni(OH)2, Fe occupies 15.95 wt.% of the total weight [Fe dopants and Ni(OH)2]. Considering that partial Ni forms NiOOH on the surface, the concentration of Fe would be less than 15.95 wt.%, lying in the optimal composition for NiFe-based catalysts[17,20,36]. The deconvoluted O 1s peaks at 531.4 eV correspond to OH-, indicating the formation of Ni(OH)2 on the surface of nanostructured Ni after dealloying. An extra peak at ~529.8 eV is present for the dealloyed sample, which might be due to the formation of the Ni-O phase after dealloying the Ni-based alloys in NaOH solutions[37].
After CV cycling, all Ni-O phase was transformed into Ni(OH)2, as confirmed by the O 1s spectra of O-Ni/200-3 in Figure 3C. When Fe ions are present during the CV cycling, the O 1s spectrum again shows the peak at ~529.7 eV. It has been reported that trace Fe ions favor the formation of β-NiOOH, which might account for the existence of Ni-O in the O 1s spectrum of O-Ni-Fe/200-3[38]. The Ni 2p spectrum of D-Ni/200-3 shows binding energies at 873.2 and 855.6 eV, representing Ni 2p1/2 and Ni 2p3/2 from Ni(OH)2, respectively
From the above analyses, it can be concluded that a Ni(OH)2 layer is formed via CV cycling in 0.1 M KOH. The surface SEM images present a rough layer on both O-Ni/200-3 and O-Ni-Fe/200-3, compared with the relatively smooth structure before electrooxidation [Figure 4A and B]. The HRTEM image [Figure 4C] obtained from the boundary area between the dealloyed and un-dealloyed zones (marked in the HAADF image of Figure 4E) of O-Ni-Fe/200-3 displays the (101) lattice plane of Ni(OH)2 and the (111) lattice plane from Ni. The SAED spectrum from the boundary area further proves the existence of Ni(OH)2 with diffraction rings from the (101) and (111) lattice planes of Ni(OH)2 [Figure 4D]. The elemental distribution suggests Fe incorporation into the surface dealloyed zones [Figure 4E]. Many point defects can be observed in the dealloyed zone, as marked by the red rectangles in Figure 4C, which might be attributed to the doping of Fe.
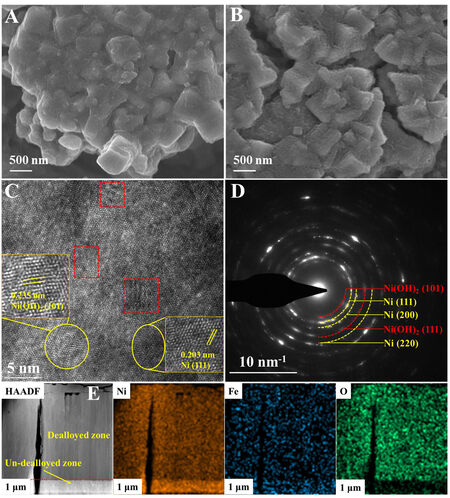
Figure 4. Surface SEM images of (A) O-Ni/200-3 and (B) O-Ni-Fe/200-3. (C) HRTEM, (D) SAED and (E) HAADF and corresponding elemental mapping images of Ni, Fe and O of O-Ni-Fe/200-3. SEM: Scanning electron microscope; HRTEM: high-resolution transmission electron microscopy; SAED: selected area electron diffraction; HAADF: high-angle annular dark field.
LSV curves were obtained in O2-saturated 1 M KOH to evaluate the OER catalytic performance. The iR-corrected LSV curves in Figure 5A reveal that O-Ni-Fe/200-3 has the best OER activity, followed by O-Ni/200-3, D-Ni/200-3, and Ni foil without any treatment. An overpotential of only 318 mV is needed to activate a current density of 10 mA cm-2, lower than 356, 361, and 360 mV for O-Ni/200-3, D-Ni/200-3, and Ni foil, respectively [Supplementary Figure 9]. At a higher current density of 100 mA cm-2, the overpotential for O-Ni-Fe/200-3 is 385 mV, which is also much lower than for other samples. Kou et al. demonstrated that a periodic porous 3D electrode could facilitate the bubble release, thereby guaranteeing a high reaction rate at high current densities[43]. The dealloying approach in this study could create columnar arrays, which might also have the potential to be used at a high current density.
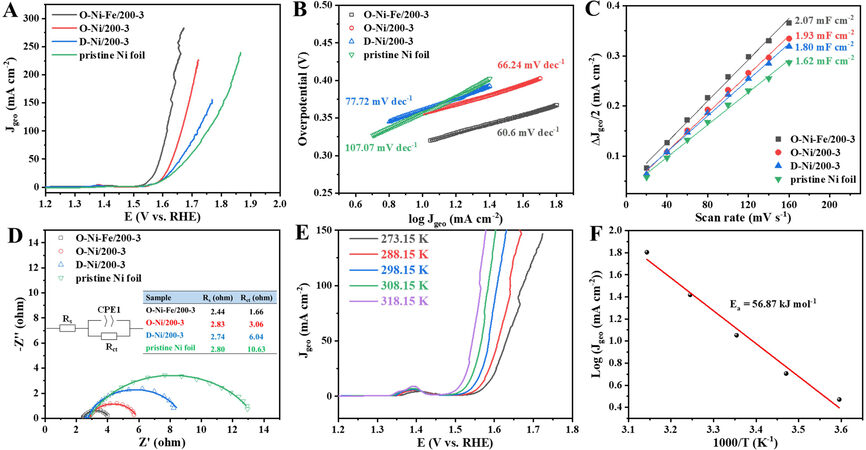
Figure 5. OER activities of different catalysts in 1 M KOH. (A) LSV polarization curves. (B) Tafel plots. (C) Plots of difference between anodic and cathodic current density at 1.188 V vs. RHE as a function of scan rate. (D) Nyquist plots at 1.624 V vs. RHE, where points and lines represent the experimental and simulated data, respectively. (E) LSV curves obtained at different temperatures. (F) Arrhenius plots at 1.53 V vs. RHE. OER: Oxygen evolution reaction; LSV: linear sweep voltammetry; RHE: reversible hydrogen electrode.
The Tafel slopes derived from the LSV curves can be used to analyze the kinetic features of the OER process. As given in Figure 5B, the Tafel slope of O-Ni-Fe/200-3 is 60.60 mV dec-1, slightly lower than for
EIS was conducted under the same conditions as the LSV tests to probe the catalytic kinetics of the catalysts. The Nyquist plots are fitted based on the equivalent circuit shown as the inset of Figure 5D. The solution resistance (Rs) and charge-transfer resistance (Rct) are listed in the inset table in Figure 5D. O-Ni-Fe/200-3 has the smallest Rct of 1.66 Ω, while Ni foil has the largest Rct of 10.63 Ω due to the lack of Ni(OH)2 active sites. Despite the significant difference in the Rct, the samples have comparable Rs values, indicating a similar charge transport efficiency. The LSV curves were also obtained at different temperatures to estimate the activation energy (Ea) for the OER. Taking O-Ni-Fe/200-3 as an example, the overpotential to activate the same current density decreases with increasing temperature [Figure 5E]. Ea is calculated through the Arrhenius equation  , where J is the current density (mA cm-2) obtained at an overpotential of 300 mV, T is the temperature (K), and R is the gas constant (8.314 J mol-1·K-1). The Ea value is 56.87 kJ mol-1 for O-Ni-Fe/200-3, as displayed in Figure 5F.
The turnover frequency values (TOF) are applied to assess the catalytic activities, which can be calculated by TOF = (J × A)/(4 × F × n), where J is the current density (mA cm-2) obtained from the LSV tests, A is the geometric area of the catalysts (0.25 cm2 in this study), four refers to the number of electrons consumed for evolving one O2 from water, F is the Faradic constant (96485 C mol-1) and n is the mole value of active sites. The value n can be calculated based on the equation of slope = (m2 × F2 × n)/(4 × R × T), where m is the number of electrons transferred for the oxidation, T is the absolute temperature (298 K), and the other terms are defined as above. The slope can be obtained from the linear relationship between the oxidation peak current and the scanning rate of the CV curves obtained at various scanning rates. Figure 6A and B show the CV curves of O-Ni-Fe/200-3 and O-Ni /200-3 at 1.0−1.6 V vs. RHE at different scanning rates. At ~1.4 V vs. RHE, an oxidation peak is found for each scanning rate. The current density corresponding to the oxidation peak increases obviously with increasing scanning rate. The oxidation peak is generated due to the transformation of Ni2+ to Ni3+[14,47]. Therefore, the number of active surface sites is calculated based on the linear dependence between the oxidation peak current and scanning rate [Figure 6C][47,48]. Assuming that all active Ni ions contribute to the OER process, TOFs can be calculated based on the number of active surface sites[49]. The TOF values as a function of overpotential are displayed in Figure 6D. The TOF value is 0.23 and 0.08 s-1 for O-Ni-Fe/200-3 and O-Ni/200-3, respectively, at an overpotential of 350 mV. These results indicate that Fe doping strongly promotes the activity of Ni(OH)2 on the surface of the catalyst. It is noteworthy that residual Ga (~10 at.% obtained from EDS and XPS) in the dealloyed Ni foil might also affect the electronic structure of Ni and modify the OER performance, as has been proved in Ga-doped Co and Pt materials[50,51].
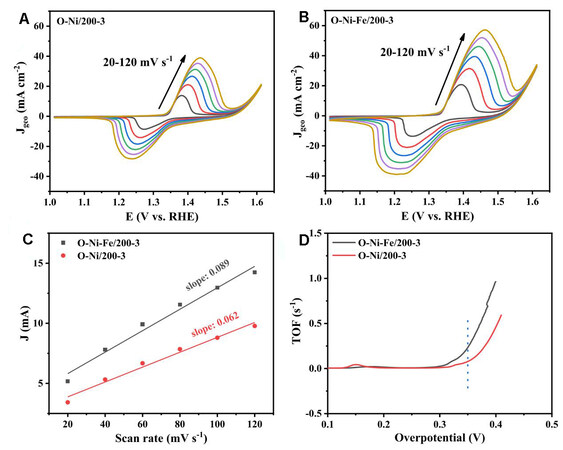
Figure 6. CVs of (A) O-Ni/200-3 and (B) O-Ni-Fe/200-3 at different scan rates (20, 40, 60, 80, 100, and 120 mV s-1) in 1.0 M KOH at 1.024-1.624 V vs. RHE. (C) Oxidation peak current intensity versus scan rate plots. (D) TOF values as a function of overpotential. RHE: Reversible hydrogen electrode; TOF: turnover frequency values.
The stability during long-term operation is essential to assess the application potential of an OER catalyst. The current density at 1.55 V vs. RHE gradually decreases from 15.8 mA cm-2 and stabilizes at
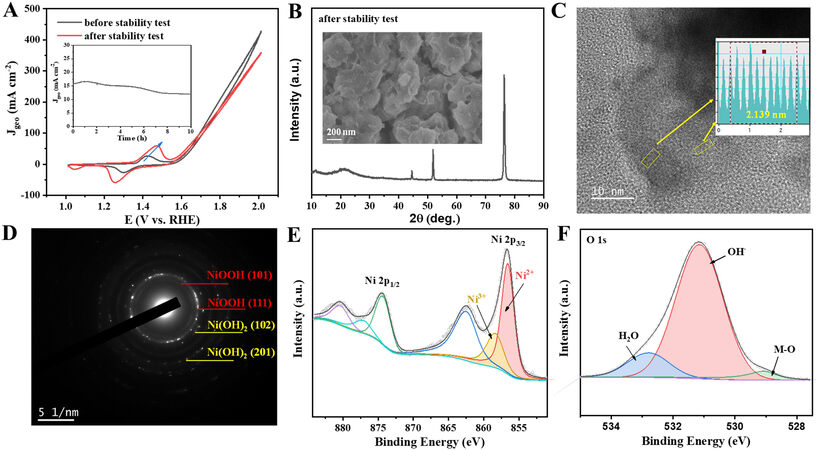
Figure 7. (A) CV curves of O-Ni-Fe/200-3 before and after i-t test; inset is the i-t curve obtained at 1.55 V vs. RHE. (B) XRD of O-Ni-Fe/200-3 after the long-term test; inset is the SEM image. (C) HETEM and (D) SAED of the tested O-Ni-Fe/200-3. (E) Ni 2p and (F) O 1s XPS spectra of tested O-Ni-Fe/200-3. RHE: Reversible hydrogen electrode; XRD: X-ray diffraction; SEM: scanning electron microscope; SAED: selected area electron diffraction; XPS: X-ray photoelectron spectroscopy.
CONCLUSION
This study demonstrates that Ga-assisted alloying-dealloying can be a powerful approach to fabricating self-supporting Ni(OH)2-based OER catalysts. By controlling the annealing temperature and time, different
DECLARATIONS
Authors’ contributionsProject administration, conceptualization, supervision: Zhang C
Manuscript writing: Wang Z, Liang P
Manuscript revision and funding acquisition: He X, Zhang Z, Zhang C
Performed data acquisition and material support: Wang Z, Li Z, Chao Y, Cui Y
Availability of data and materialsNot applicable.
Financial support and sponsorshipThis work was supported by the National Natural Science Foundation of China (No. 51901161), Natural Science Foundation of Guangdong Province (No. 2021A1515011955), College Innovation Team Project of Guangdong Province (No. 2021KCXTD042), Major Projects of Guangdong Education Department for Foundation Research and Applied Research (No. 2020ZDZX2063; No. 2019KZDXM065), Wuyi University-Hong Kong-Macau Joint Research and Development Fund (No. 2019WGALH06).
Conflicts of interestAll authors declared that there are no conflicts of interest.
Ethical approval and consent to participateNot applicable.
Consent for publicationNot applicable.
Copyright© The Author(s) 2022.
Supplementary MaterialsREFERENCES
1. Roger I, Shipman MA, Symes MD. Earth-abundant catalysts for electrochemical and photoelectrochemical water splitting. Nat Rev Chem 2017:1.
2. Chu S, Majumdar A. Opportunities and challenges for a sustainable energy future. Nature 2012;488:294-303.
3. Zhang B, Wang L, Cao Z, et al. High-valence metals improve oxygen evolution reaction performance by modulating 3d metal oxidation cycle energetics. Nat Catal 2020;3:985-92.
4. Wei C, Rao RR, Peng J, et al. Recommended practices and benchmark activity for hydrogen and oxygen electrocatalysis in water splitting and fuel cells. Adv Mater 2019;31:e1806296.
5. Suen NT, Hung SF, Quan Q, Zhang N, Xu YJ, Chen HM. Electrocatalysis for the oxygen evolution reaction: recent development and future perspectives. Chem Soc Rev 2017;46:337-65.
6. Xue Q, Bai X, Zhao Y, et al. Au core-PtAu alloy shell nanowires for formic acid electrolysis. J Energy Chem 2022;65:94-102.
7. Ding Y, Cao K, He J, et al. Nitrogen-doped graphene aerogel-supported ruthenium nanocrystals for pH-universal hydrogen evolution reaction. Chinese J Catal 2022;43:1535-43.
8. Hu F, Wang H, Zhang Y, et al. Designing highly efficient and long-term durable electrocatalyst for oxygen evolution by coupling B and P into amorphous porous NiFe-based material. Small 2019;15:e1901020.
9. Gong M, Dai H. A mini review of NiFe-based materials as highly active oxygen evolution reaction electrocatalysts. Nano Res 2015;8:23-39.
10. Zhu YP, Ma TY, Jaroniec M, Qiao SZ. Self-templating synthesis of hollow Co3O4 microtube arrays for highly efficient water electrolysis. Angew Chem Int Ed 2017;56:1324-8.
11. Suntivich J, Gasteiger HA, Yabuuchi N, Nakanishi H, Goodenough JB, Shao-horn Y. Design principles for oxygen-reduction activity on perovskite oxide catalysts for fuel cells and metal-air batteries. Nature Chem 2011;3:546-50.
12. Peng S, Gong F, Li L, et al. Necklace-like multishelled hollow spinel oxides with oxygen vacancies for efficient water electrolysis. J Am Chem Soc 2018;140:13644-53.
13. Wu Z, Lu XF, Zang SQ, Lou XW. Non-noble-metal-based electrocatalysts toward the oxygen evolution reaction. Adv Funct Mater 2020;30:1910274.
14. Trotochaud L, Young SL, Ranney JK, Boettcher SW. Nickel-iron oxyhydroxide oxygen-evolution electrocatalysts: the role of intentional and incidental iron incorporation. J Am Chem Soc 2014;136:6744-53.
15. Xuan C, Lei W, Wang J, et al. Sea urchin-like Ni-Fe sulfide architectures as efficient electrocatalysts for the oxygen evolution reaction. J Mater Chem A 2019;7:12350-7.
16. Zhou W, Wu X, Cao X, et al. Ni3S2 nanorods/Ni foam composite electrode with low overpotential for electrocatalytic oxygen evolution. Energy Environ Sci 2013;6:2921.
17. Friebel D, Louie MW, Bajdich M, et al. Identification of highly active Fe sites in (Ni,Fe)OOH for electrocatalytic water splitting. J Am Chem Soc 2015;137:1305-13.
18. Zhang F, Shi Y, Xue T, Zhang J, Liang Y, Zhang B. In situ electrochemically converting Fe2O3-Ni(OH)2 to NiFe2O4-NiOOH: a highly efficient electrocatalyst towards water oxidation. Sci China Mater 2017;60:324-34.
19. Corrigan DA. The catalysis of the oxygen evolution reaction by iron impurities in thin film nickel oxide electrodes J Electrochem Soc 1987;134:377-84.
20. Klaus S, Cai Y, Louie MW, Trotochaud L, Bell AT. Effects of Fe electrolyte impurities on Ni(OH)2/NiOOH structure and oxygen evolution activity. J Phys Chem C 2015;119:7243-54.
21. Sun H, Yan Z, Liu F, Xu W, Cheng F, Chen J. Self-supported transition-metal-based electrocatalysts for hydrogen and oxygen evolution. Adv Mater 2020;32:e1806326.
22. Pi Y, Shao Q, Wang P, et al. Trimetallic oxyhydroxide coralloids for efficient oxygen evolution electrocatalysis. Angew Chem Int Ed 2017;56:4502-6.
23. Zhu Y, Liu Y, Ren T, Yuan Z. Self-supported cobalt phosphide mesoporous nanorod arrays: a flexible and bifunctional electrode for highly active electrocatalytic water reduction and oxidation. Adv Funct Mater 2015;25:7337-47.
24. Xu K, Wang F, Wang Z, et al. Component-controllable WS(2(1-x))Se(2x) nanotubes for efficient hydrogen evolution reaction. ACS Nano 2014;8:8468-76.
25. Kou T, Wang S, Hauser JL, et al. Ni foam-supported Fe-Doped β-Ni(OH)2 nanosheets show ultralow overpotential for oxygen evolution reaction. ACS Energy Lett 2019;4:622-8.
26. Kou T, Chen M, Wu F, et al. Carbon doping switching on the hydrogen adsorption activity of NiO for hydrogen evolution reaction. Nat Commun 2020;11:590.
27. Hu F, Zhu S, Chen S, et al. Amorphous metallic NiFeP: a conductive bulk material achieving high activity for oxygen evolution reaction in both alkaline and acidic media. Adv Mater 2017;29:1606570.
28. Zheng D, Zhao F, Li Y, et al. Flexible NiO micro-rods/nanoporous Ni/metallic glass electrode with sandwich structure for high performance supercapacitors. Electrochim Acta 2019;297:767-77.
29. Wang Z, Gao H, Niu J, Zhang C, Zhang Z. Transforming bulk metals into metallic nanostructures: a liquid-metal-assisted top-down dealloying strategy with sustainability. ACS Sustainable Chem Eng 2019;7:3274-81.
30. Wang Z, Wang Y, Gao H, et al. “Painting” nanostructured metals-playing with liquid metal. Nanoscale Horiz 2018;3:408-16.
31. Zhang J, Dong C, Wang Z, et al. Flexible, self-supported hexagonal β-Co(OH)2 nanosheet arrays as integrated electrode catalyzing oxygen evolution reaction. Electrochim Acta 2018;284:495-503.
32. Liu Y, Bliznakov S, Dimitrov N. Factors controlling the less noble metal retention in nanoporous structures processed by electrochemical dealloying. J Electrochem Soc 2010;157:K168.
33. Zhang J, Bai Y, Zhang C, et al. Hybrid Ni(OH)2/FeOOH@NiFe nanosheet catalysts toward highly efficient oxygen evolution reaction with ultralong stability over 1000 hours. ACS Sustainable Chem Eng 2019;7:14601-10.
34. Stevens MB, Trang CDM, Enman LJ, Deng J, Boettcher SW. Reactive Fe-sites in Ni/Fe (Oxy)hydroxide are responsible for exceptional oxygen electrocatalysis activity. J Am Chem Soc 2017;139:11361-4.
35. Ren JT, Yuan GG, Weng CC, Chen L, Yuan ZY. Uniquely integrated Fe-doped Ni(OH)2 nanosheets for highly efficient oxygen and hydrogen evolution reactions. Nanoscale 2018;10:10620-8.
36. Son YJ, Kawashima K, Wygant BR, et al. Anodized nickel foam for oxygen evolution reaction in fe-free and unpurified alkaline electrolytes at high current densities. ACS Nano 2021;15:3468-80.
37. Wang Z, Zhang X, Liu X, et al. Bimodal nanoporous NiO@Ni-Si network prepared by dealloying method for stable Li-ion storage. J Power Sources 2020;449:227550.
38. Wu Y, Zhao MJ, Li F, Xie J, Li Y, He JB. Trace Fe incorporation into Ni-(oxy)hydroxide stabilizes Ni3+ sites for anodic oxygen evolution: a double thin-layer study. Langmuir 2020;36:5126-33.
40. Biesinger MC, Payne BP, Grosvenor AP, Lau LW, Gerson AR, Smart RS. Resolving surface chemical states in XPS analysis of first row transition metals, oxides and hydroxides: Cr, Mn, Fe, Co and Ni. Appl Surfa Sci 2011;257:2717-30.
41. Smith RD, Prévot MS, Fagan RD, Trudel S, Berlinguette CP. Water oxidation catalysis: electrocatalytic response to metal stoichiometry in amorphous metal oxide films containing iron, cobalt, and nickel. J Am Chem Soc 2013;135:11580-6.
42. Yamashita T, Hayes P. Analysis of XPS spectra of Fe2+ and Fe3+ ions in oxide materials. Appl Surf Sci 2008;254:2441-9.
43. Kou T, Wang S, Shi R, et al. Periodic porous 3D electrodes mitigate gas bubble traffic during alkaline water electrolysis at high current densities. Adv Energy Mater 2020;10:2002955.
44. Zhang C, Xie Z, Liang Y, et al. Morphological and compositional modification of β-Ni(OH)2 nanoplates by ferrihydrite for enhanced oxygen evolution reaction. Int J Hydrog Energy 2021;46:17720-30.
45. Lyons MEG, Doyle RL, Godwin I, O’brien M, Russell L. Hydrous nickel oxide: redox switching and the oxygen evolution reaction in aqueous alkaline solution. J Electrochem Soc 2012;159:H932-44.
46. Stevens MB, Enman LJ, Batchellor AS, et al. Measurement techniques for the study of thin film heterogeneous water oxidation electrocatalysts. Chem Mater 2017;29:120-40.
47. Guo X, Kong R, Zhang X, Du H, Qu F. Ni(OH)2 Nanoparticles embedded in conductive microrod array: an efficient and durable electrocatalyst for alkaline oxygen evolution reaction. ACS Catal 2018;8:651-5.
48. Zou X, Goswami A, Asefa T. Efficient noble metal-free (electro)catalysis of water and alcohol oxidations by zinc-cobalt layered double hydroxide. J Am Chem Soc 2013;135:17242-5.
49. Surendranath Y, Kanan MW, Nocera DG. Mechanistic studies of the oxygen evolution reaction by a cobalt-phosphate catalyst at neutral pH. J Am Chem Soc 2010;132:16501-9.
50. Zhang S, Zhang J, Liang P, Zhang C, Kou T, Zhang Z. Corrosion engineering derived Ga doped CoSe2 nanosheets intrinsically active for oxygen evolution reaction. J Power Sources 2021;497:229895.
Cite This Article
Export citation file: BibTeX | RIS
OAE Style
Wang Z, Li Z, Chao Y, Cui Y, He X, Liang P, Zhang C, Zhang Z. Dealloying-derived Fe-doped Ni(OH)2/Ni foils as self-supported oxygen evolution reaction catalysts. Energy Mater 2022;2:200019. http://dx.doi.org/10.20517/energymater.2022.19
AMA Style
Wang Z, Li Z, Chao Y, Cui Y, He X, Liang P, Zhang C, Zhang Z. Dealloying-derived Fe-doped Ni(OH)2/Ni foils as self-supported oxygen evolution reaction catalysts. Energy Materials. 2022; 2(3): 200019. http://dx.doi.org/10.20517/energymater.2022.19
Chicago/Turabian Style
Wang, Zheng, Zhenhan Li, Yang Chao, Yu Cui, Xin He, Ping Liang, Chi Zhang, Zhonghua Zhang. 2022. "Dealloying-derived Fe-doped Ni(OH)2/Ni foils as self-supported oxygen evolution reaction catalysts" Energy Materials. 2, no.3: 200019. http://dx.doi.org/10.20517/energymater.2022.19
ACS Style
Wang, Z.; Li Z.; Chao Y.; Cui Y.; He X.; Liang P.; Zhang C.; Zhang Z. Dealloying-derived Fe-doped Ni(OH)2/Ni foils as self-supported oxygen evolution reaction catalysts. Energy Mater. 2022, 2, 200019. http://dx.doi.org/10.20517/energymater.2022.19
About This Article
Copyright

Data & Comments
Data


 Cite This Article 17 clicks

 Like This Article 1
likes
Like This Article 1
likes


Comments
Comments must be written in English. Spam, offensive content, impersonation, and private information will not be permitted. If any comment is reported and identified as inappropriate content by OAE staff, the comment will be removed without notice. If you have any queries or need any help, please contact us at support@oaepublish.com.