
Ion transport, mechanical properties and relaxation dynamics in structural battery electrolytes consisting of an imidazolium protic ionic liquid confined into a methacrylate polymer
 0
0
Abstract
The effect of confining a liquid electrolyte into a polymer matrix was studied by means of Raman spectroscopy, differential scanning calorimetry, temperature-modulated differential scanning calorimetry, dielectric spectroscopy, and rheology. The polymer matrix was obtained from thermal curing ethoxylated bisphenol A dimethacrylate while the liquid electrolyte consisted of a protic ionic liquid based on the ethyl-imidazolium cation [C2HIm] and the bis(trifluoromethanesulfonyl)imide [TFSI] anion, doped with LiTFSI salt. We report that the confined liquid phase exhibits the following characteristics: (i) a distinctly reduced degree of crystallinity; (ii) a broader distribution of relaxation times; (iii) reduced dielectric strength; (iv) a reduced cooperativity length scale at the liquid-to-glass transition temperature (Tg); and (v) up-speeded local Tg-related ion dynamics. The latter is indicative of weak interfacial interactions between the two nanophases and a strong geometrical confinement effect, which dictates both the ion dynamics and the coupled structural relaxation, hence lowering Tg by about 4 K. We also find that at room temperature, the ionic conductivity of the structural electrolyte achieves a value of
Keywords
INTRODUCTION
Over the past decades, lithium (Li)-ion batteries have gained the market as the main power and energy storage systems in electrified transportation, a vital field for the realization of a sustainable and environmentally friendly society[1,2]. To meet the emerging demands of longer driving ranges and faster charging rates, higher energy/power densities or higher energy-to-weight ratios are needed. The latter can be achieved by developing a “mass-less energy storage system”, also known as a structural battery, that consists of lightweight multifunctional materials[3-8]. Such a structural battery is based on carbon fiber-reinforced polymer composites able to store electrical energy in load-bearing body parts, e.g., in the roof or in the body panel of a car, in the interior of an airplane, or in parts of electric ferries[9-12]. In structural batteries, carbon fibers are used as a host for Li ions and for the conduction of electrons while also providing mechanical reinforcement. The matrix material in structural batteries not only supports ion transport but also enables transfer of mechanical load. By this design, the battery is simultaneously part of the structure and the source of power[3-12].
One of the key challenges to achieving multifunctionality in structural batteries is the design of a suitable structural battery electrolyte (SBE), which simultaneously exhibits high Li-ion conductivity (σdc > 1 mS/cm) and enables mechanical load transfer to the carbon fibers[13]. Since the pioneering study from 2007 by the US Army[14], the scientific interest has turned to the design of novel microphase-separated heterogeneous structural electrolytes comprising two segregated phases: a glassy, rigid phase of a polymer matrix and a liquid ion-conducting phase that are independently responsible for the mechanical and the ion-conduction properties, respectively[13-25]. In this context, Ihrner et al. established a phase-separated methacrylate-based SBE by a UV-cured synthetic method, in which the conductive phase consisted of an organic electrolyte[15]. This system had an elastic modulus of about 360 MPa and an ionic conductivity of 0.2 mS/cm at ambient temperature[15]. In a subsequent study[16], it was evidenced that a thermal curing processing route was beneficial for the synthesis of phase-separated methacrylate-based SBE films and structural electrodes, yielding a combination of improved thermo-mechanical properties (up to 750 MPa) and electrochemical performance, similar to that found in UV-cured ones. Nevertheless, the use of organic solvents is accompanied by safety issues related to their flammability and volatility, increasing the risk of fire and explosion, hence limiting the temperature range of safe operation.
To alleviate the safety issues encountered with organic solvents, ionic liquids may be considered as part of the ion-conducting phase instead. Ionic liquids are salts composed mainly of organic ions that melt at low temperatures[26-33]; they exhibit high thermal stability (low flammability), large electrochemical stability windows, and negligible vapor pressure. In the bulk phase, aprotic ionic liquids doped with a Li-salt exhibit higher conductivities than poly(ethylene oxide) (PEO)/LiTFSI polymer electrolytes but significantly lower than ethylene carbonate/LiTFSI electrolytes, reflecting the trend of viscosity[32]. However, to advance the performance of ionic liquid-based materials, it is pivotal to understand their properties while confined into polymeric or inorganic matrices, materials also known as ionogels[34-40].
The incorporation of ionic liquids into cross-linked polymer matrices, obtained by a synthetic method that induces phase separation, can result in high ionic conductivities at ambient temperature without sacrificing the required mechanical strength, as first evidenced by Matsumoto et al.[21]. Specifically, a micro-separation between 1-ethyl-3-methylimidazolium bis(trifluoromethanesulfonyl)imide ([C2C1Im][TFSI]) and the solid (cross-linked epoxy resin based on bisphenol A) phase and a good combination of ionic conductivity and Young’s modulus were revealed for ionic liquid contents above 40 wt.%[21]. Concomitantly, Shirshova et al. reported a clear correlation between the morphology, ionic conductivity, and mechanical performance of ionic liquid ([C2C1Im][TFSI])-epoxy resin structural electrolytes, which can be further engineered by the type and the composition of the epoxy resin[22]. An optimum ionic liquid composition of 70 wt.% was revealed, which yielded a room temperature conductivity of 0.8 mS/cm and Young’s modulus of 0.2 GPa, reflecting a long characteristic length scale of each structure (spinodal microstructure)[22]. In a subsequent work[23], a strong effect of the Li-salt concentration on ionic conductivity was evidenced, the latter changing by about two orders of magnitude. Further, Yu et al. reported an ionic conductivity of 0.1 mS/cm and a tensile modulus of 200 MPa in SBEs comprising a solid phase based on an epoxy resin and a liquid ion-conducting phase based on mixing an aprotic ionic liquid ([C2C1Im][TFSI]) with an organic solvent [propylene carbonate (PC)][24]. Moreover, Kwon et al. recently studied a novel SBE based on an epoxy combined with the aprotic ionic liquid [C2C1Im][TFSI] doped with LiTFSI (including the inorganic filler
The effect of hard confinement on the dynamics of small molecules (i.e., water and other hydrogen bonded liquids and ionic liquids) and polymers has been of great scientific interest[43-55]. In confinement, there are two competing factors that determine the relaxation dynamics: (i) surface interactions; and (ii) geometrical confinement. The former factor tends to dominate at higher temperatures, causing a slowing down of the dynamics, compared to the bulk. On the other hand, the impact of geometrical confinement is stronger at lower temperatures, in the vicinity of the glass transition temperature (Tg), and tends to speed up viscosity-related relaxation dynamics, thus lowering Tg, as compared to the bulk[45,54,55]. There are several possible explanations for why geometrical confinement generally speeds up the local dynamics. One potential cause is that the liquid molecules have difficulties being equally packed as in the bulk liquid, causing the free volume to increase with the result of faster dynamics. Another explanation can be that the cooperativity length decreases, which also makes it easier for the molecules to move. To understand how the viscosity-related dynamics can be enhanced in confinement, it is important to elucidate how the Tg and the associated relaxation dynamics are altered.
Herein, we present the investigation of the thermodynamic phase diagram, ion conduction, relaxation dynamics, and mechanical properties for a series of SBEs comprising a glassy phase derived from EBPADMA and an ion-conducting phase based on the PIL ethylimidazolium bis(trifluoromethanesulfonyl)imide, abbreviated as [C2HIm][TFSI], doped with the salt LiTFSI. Properties are investigated by employing differential scanning calorimetry (DSC)/temperature-modulated (TM)-DSC, dielectric spectroscopy, rheology, and Raman spectroscopy. We report that upon incorporation into the polymer matrix, the crystallinity of the liquid phase significantly reduces, and the local dynamics speed up (lower Tg), indicating weak interfacial interactions and a favorable geometrical confinement effect. Doping with the Li-salt further destabilizes the crystalline order but slightly increases Tg due to stronger ionic interactions that increase viscosity. To summarize, we find that the maximum room temperature ionic conductivity for the SBE doped with LiTFSI is as high as 0.13 mS/cm, only one decade lower than the corresponding bulk liquid phase. The reduced conductivity can be explained by non-perfect connectivity of the liquid phase, and improvements will be needed to reach the desired and targeted conductivity of about
EXPERIMENTAL
Materials
The PIL 1-Ethylimidazolium bis(trifluoromethylsulfonyl)imide [C2HIm][TFSI], 98% purity, was purchased from Iolitec. The monomer ethoxylated bisphenol A dimethacrylate (EBPADMA, Mw 540 g/mol) was provided by Sartomer (Arkema Group). The salt lithium bis(trifluoromethane)sulfonimide (LiTFSI) and the thermal initiator 2,2′-azobis(2-methylpropionitrile) (AIBN) were purchased from Sigma-Aldrich. All chemicals were used as received without further treatment. The chemical structure of these compounds is shown in Figure 1.
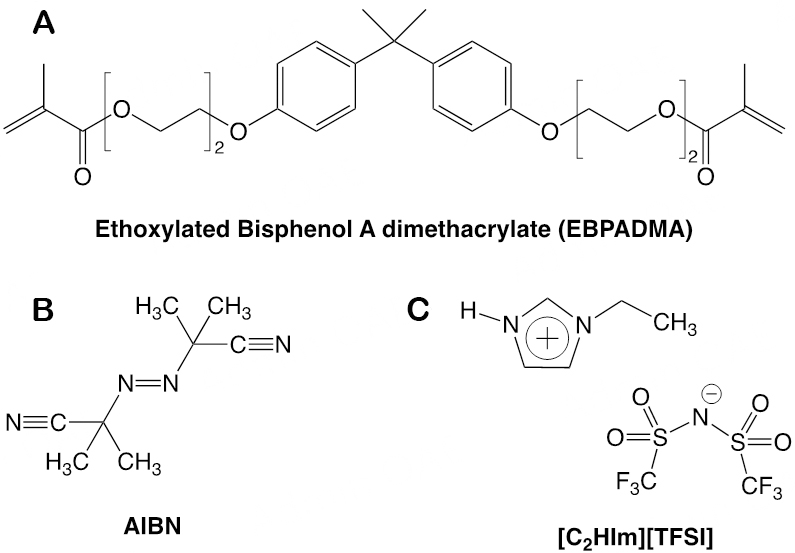
Figure 1. Chemical structure of the used compounds: (A) the methacrylate-based monomer; (B) the initiator; and (C) the protic ionic liquid.
Synthesis
SBEs derived from the monomer EBPADMA and the liquid mixture [C2HIm][TFSI]/LiTFSI were all prepared inside a N2 filled glovebox (MBRAUN UNIlab Plus Eco glovebox with an MB-LMF II solvent absorber system; < 1 ppm H2O; < 1 ppm O2). The liquid phases were prepared first by mixing LiTFSI with the PIL [C2HIm][TFSI] at different salt concentrations, i.e., 0.0, 0.1, and 0.2 m. As for the labeling of samples, a solid polymer electrolyte based on EBPADMA and a [C2HIm][TFSI]/LiTFSI solution with a concentration of 0.2 m is labeled EBPADMA + [C2HIm][TFSI]/LiTFSI0.2.
For the synthesis of these polymer electrolytes, the [C2HIm][TFSI]/LiTFSI solution was first mixed with the monomer and with the thermal initiator AIBN in a glass vial. The AIBN content was 1 wt.% relative to the monomer. The liquid electrolyte content was kept equal to 50 wt.% of the total weight. This mixture of chemicals was then stirred using a vortex apparatus until a homogeneous solution was obtained. The mixture was then left to rest for 20 min in order to make all air bubbles escape.
As a second step, the prepared solution was poured onto a borosilicate petri dish. Then, the petri dish was inserted into a zipped bag and let cure over a metallic plate inside the glovebox, setting the temperature at 75 °C and letting cure for 180 min. During curing, polymerization occurs. The image of a defect-free solid polymer electrolyte obtained by this procedure is shown in Figure 2A, while the chemical structure after polymerization is illustrated in Figure 2B.

Figure 2. (A) Picture of the solid polymer electrolyte EBPADMA + [C2HIm][TFSI]/LiTFSI0.2 and (B) sketch of the radical polymerization of EBPADMA monomers.
Thermogravimetric analysis
Thermogravimetric analysis (TGA) experiments were performed on a Mettler Toledo TGA/DSC3+ equipped with an autosampler. A XS105 semi-micro balance from Mettler Toledo was used to weigh the samples. A small amount of sample (~20 mg) was placed inside a 70 L aluminum crucible capped with an aluminum lid with a pinhole. The samples were then measured under air flow (60 L/min) from 25 to 800 °C at a heating rate of 10 K/min.
Scanning electron microscopy
Scanning electron microscopy (SEM) images were taken using a Zeiss Ultra 55 FEG microscope. The studied samples were gold coated before the analysis using Leica EM TXP equipment. The diameter of the gold nanoparticles used is about 6 nm. Before collecting the SEM images, the ionic liquid was extracted with ethanol using a Soxhlet apparatus for 24 h.
Nitrogen sorption
Nitrogen sorption isotherms were recorded at 77 K using a Micromeritics TriStar volumetric apparatus by adding doses of N2 in a measurement cell after an outgassing treatment of the extracted samples at 80 °C under mild vacuum overnight. The samples were extracted with ethanol using a Soxhlet apparatus for 24 h. The Brunauer-Emmett-Teller (BET) surface area of each sample was determined using the BET method in the linear range of the isotherms, typically at p/p0 = 0.05-0.15[56]. The pore size distribution was calculated using the Barret-Joyner-Halenda (BJH) method from the adsorption isotherm[57]. The total pore volume of the materials was determined at p/p0 = 0.99.
Calorimetric measurements
DSC measurements were performed for the determination of phase transition temperatures in the investigated electrolytes by employing a Q2000 (TA Instruments) setup equipped with a liquid nitrogen cooling system (LNCS). The temperature protocol involves a cooling scan to 153 K followed by a heating scan to 333 K, both at a rate of 10 K/min and under nitrogen flow. This procedure was repeated twice, with reproducible results. The Tg and the melting temperature (Tm) were analyzed in the heating scan of the second cycle. The instrument was calibrated for best performance in the specific temperature range and for the used heating/cooling rates. Pre-calibration procedures included (i) cleaning the cell; (ii) conditioning the cell (making an inert atmosphere by employing helium gas); and (iii) performing a LNCS baseline calibration. The main zero calibration sequence included a baseline calibration for the determination of the time constants and capacitances of the sample and reference sensor using a sapphire standard. In the subsequent step, an indium standard (ΔH = 28.71 J/g, Tm = 428.8 K, with a heating rate of 10 K/min) was employed for the calibration of enthalpy and transition temperatures. Finally, a baseline measurement was done with an empty cell to verify the successful calibration of the instrument. Concerning the heat capacity calibration, a TM-DSC calibration was made with a sapphire standard. Samples with masses of 10-14 mg were encapsulated in hermetic aluminum pans using a sealing press and placed on the sample sensor. As a reference, an empty aluminum pan was used.
In addition to standard DSC, TM-DSC measurements were carried out to identify the dynamic nature of the confined liquid phase. The measurements were performed, covering the temperature range from 163 to 223 K. In TM-DSC, a low-frequency sinusoidal perturbation is added to the standard DSC profile, according to T = T0 + βt + ATsin(ωt), where β is the linear heating rate, t the time, AT the amplitude, and ω the angular frequency[58,59]. An amplitude of 1 K and periods in the range from 40 to 200 s were applied. The linear heating rate for each period of modulation was calculated from β = (ΔT/nΠ)60 s/min, where ΔT is the temperature width of the glass “transition” (between the “onset” and “end” temperature), n is the number of modulation cycles (n = 6), and Π is the period of modulation. By assuming a width of Tg of around 10 K, linear heating rates from 5 to 0.5 K/min were employed.
Dielectric spectroscopy
Dielectric measurements were performed using a Novocontrol GmbH broadband dielectric spectrometer, covering the frequency range 10-2-107 Hz. The solid electrolytes were painted with silver paste for good contact with the two stainless-steel electrodes (5 and 10 mm in diameter). The diameter of the silver-pasted area (ranging from 7 mm to 9 mm for the different samples) and the sample thickness (ranging from 700 to 900 μm in the different samples) were measured with a Mitutoyo absolute digital caliper. For the liquid electrolytes, the liquid parallel plate sample cell (BDS 1308) was employed with stainless steel electrodes
where ω is the angular frequency, and ε0 is the permittivity of free space.
Rheology
A MCR 302 rheometer by Anton Paar was employed for the measurements of the shear modulus in structural electrolytes. A plate-plate geometry with a diameter of 8 mm was used. The samples were prepared on the lower rheometer plate. Then, the upper plate was brought into contact, and the thickness was adjusted. Temperature control was achieved within ±0.1 K with a cooling circulator provided by Anton Paar. Two types of measurements (in an oscillatory mode) were carried out in the linear viscoelastic regime:
Raman spectroscopy
Raman spectra were collected at room temperature using a Renishaw InVia Reflex Raman spectrophotometer equipped with an air-cooled CCD detector. A 785 nm wavelength diode laser was used as the excitation source, while the grating used had 1,200 grooves/mm. The Raman spectra of the ionic liquid and salt mixtures were collected at room temperature, covering the 100-4,000 cm-1 spectral range and keeping the samples inside sealed NMR tubes. The samples were loaded inside a glovebox. The Raman spectra of SBEs were collected from self-standing samples in air, also at room temperature. The laser power was set to 10% of its maximum value, which is about 300 mW at the source. Raman spectra are the result of ten accumulations with ten seconds of acquisition time each. Before each measurement, the spectrophotometer was calibrated to the first-order vibrational mode of a Si wafer centered at 520.6 cm-1. The raw Raman spectra were treated by excluding sharp signals coming from cosmic rays. For further analysis and to estimate integrated areas, a multipeak fit procedure based on a linear background and Voigt functions was applied using the Igor Pro 9 software. In the fitting procedure, the width and position of the Voigt components were not subjected to any constraints.
RESULTS AND DISCUSSION
Thermal properties and morphology
The TGA results show that the pure PIL decomposes in two consecutive steps, the first one starting at around 300 °C. Upon confinement, the first step shifts to slightly lower temperatures, and an additional feature is observed, which is attributed to the decomposition of the polymer, see Supplementary Figure 1.
A representative, cross-section SEM image of sample EBPADMA + [C2HIm][TFSI]/LiTFSI0.2 is shown in Figure 3A. After the extraction of the ionic liquid, the polymer phase shows an interconnected pore architecture with a wide pore size distribution (from micro- to macropores). Additional SEM images taken on the surface of the samples are available in the [Supplementary Figure 2].

Figure 3. (A) SEM image of the cross-section of sample EBPADMA + [C2HIm][TFSI]/LiTFSI0.2 with 200 nm scale bar. (B) Nitrogen sorption isotherms of EBPADMA + [C2HIm][TFSI] (red circles) and EBPADMA + [C2HIm][TFSI]/LiTFSI0.2 (blue squares) samples. The inset shows the BJH adsorption pore distribution of both studied samples.
Additionally, nitrogen sorption isotherms of the EBPADMA + [C2HIm][TFSI] and EBPADMA +
These results highlight the interconnected porosity of the studied SBEs displaying a wide range of pore sizes. However, as discussed below, some pores have dead-ends that cannot be measured by nitrogen sorption measurements. Moreover, as clearly seen in Figure 3, some of the pores observed in SEM are much larger than those measured by nitrogen sorption analysis (a technique that does not detect macro-pores larger than a few hundred nanometers).
Thermodynamics - phase diagram
Upon confinement of the bulk PIL into the structure of a polymer matrix, the temperatures of the first order transitions, the degree of crystallinity, and the Tg associated with the amorphous part of the liquid phase can be affected. DSC and TM-DSC calorimetric measurements were carried out for the EBPADMA-based solid electrolytes and their respective bulk PILs to estimate these changes, as summarized in Figure 4.

Figure 4. (A) DSC thermograms of the EBPADMA + [C2HIm][TFSI]/LiTFSI electrolytes (blue) and their corresponding liquid electrolytes [C2HIm][TFSI]/LiTFSI (black), with a Li-salt concentration equal to either 0.0 m (dashed lines) or 0.2 m (solid lines). The DSC traces shown are those recorded during the second heating at a rate of 10 K/min. The thermograms are vertically offset for clarity. (B) Reversing heat capacity as a function of temperature for samples [C2HIm][TFSI]/LiTFSI0.2 (black) and EBPADMA +
As illustrated in Figure 4, the confinement of the bulk PIL into the cured polymer distinctly affects the thermodynamic properties. The DSC traces of the solid electrolytes exhibit two liquid-to-glass temperatures, Tgs, indicating segregation between the ion-conducting liquid phase and the solid phase. The lower Tg is associated with the vitrification of the amorphous part of the ionic liquid, while the higher Tg is linked to the vitrification of the cross-linked glassy polymer matrix. The chemico-physical cross-linking of the polymer matrix via thermal curing results in a broad Tg (at ~360 K) with a width of about 50 K. Also, in the temperature range between the two Tgs, a cold crystallization exothermic peak at Tcc ~230 K, followed by a melting peak at ~278 K, can be observed. This decreases by about 5-10 K compared to the bulk phase as an effect of geometrical confinement and in accordance with the literature[54]. However, in contrast to the case of the bulk liquid phase, for which the cold-crystallization (melting) temperature increases (decreases) with increasing Li-salt concentration, the first order transitions for the confined PIL are relatively unaffected by the Li-salt content. The temperatures of the first order phase transitions and the corresponding change of enthalpy are provided in Supplementary Table 1 as well as in Figure 4C and D, the orange and green arrows guiding through the effect of confinement and of increasing Li-salt concentration, respectively. As expected, the degree of crystallinity significantly reduces upon confinement of the liquid phase into the polymer. More specifically, the enthalpy change of fusion decreases by about 30 J/g in EBPADMA +
Moreover, the incorporation of the liquid phase into the polymer matrix has a strong impact on the glassy state of the confined liquid phase, as can be observed in the TM-DSC thermograms. As shown in
Chemical homogeneity and intermolecular interactions
By Raman spectroscopy, the actual chemical composition of the synthesized solid polymer electrolytes and the nature of established intermolecular interactions were investigated. A selection of Raman spectra collected from the precursor monomer, the neat PIL, and the SBEs after curing are shown in Figure 5.

Figure 5. Selection of Raman spectra collected at room temperature for the neat protic ionic liquid ([C2HIm][TFSI]), the neat monomer (EBPADMA), the cured monomer including the protic ionic liquid (EBPADMA + [C2HIm][TFSI]) and the cured monomer including the protic ionic liquid mixed with LiTFSI at 0.2 m (EBPADMA + [C2HIm][TFSI]/LiTFSI0.2). The inset shows the vibrational modes used to estimate the degree of polymerization.
First of all, the degree of curing was analyzed by investigating the intensity change of the Raman active mode arising from C=C stretching (1,640 cm-1) with reference to the intensity of the C-C stretching mode (1,610 cm-1) of the phenyl group that is not taking part in the polymerization reaction, see the inset of Figure 5[60]. In fact, the intensity of the C=C mode at 1,640 cm-1 decreases with respect to the phenyl group mode as a consequence of polymerization, and from the analysis of the integrated areas under these peaks, we estimate a conversion value of about 86 ± 0.4% (the error is associated with the accuracy of the fitting of the integrated Raman intensities). The latter was also calculated from the DSC thermogram by employing a non-isothermal method and integrating the exothermic peak (found at T ~400 K) associated with the polymerization (curing) of residual monomers [Supplementary Figure 4]. A conversion value of 94% ± 2% was estimated, a value slightly higher than that found from Raman spectroscopy but reasonably close. This value is the same for the samples prepared with and without the addition of the Li-TFSI salt and is also in agreement with values previously reported for equivalent materials, although analyzed by means of infrared spectroscopy[16].
The lower spectral range between 240 and 450 cm-1 includes vibrations that are sensitive to conformational changes. As already discussed in the literature, the TFSI anion can adopt the cis or the trans conformation, each contributing with distinct but energetically close Raman intensities[31]. The collected Raman spectra shown in Figure 5 indicate the co-existence of both conformations, although we did not further investigate this region to quantitatively estimate the population of each of those.
The synthesized solid polymer electrolytes were also investigated to get insights into their homogeneity from a chemical composition point of view. For this purpose, Raman spectra were collected at arbitrarily selected spots on both sides of the material (top and bottom sides) and along a line cross-sectioning the thickness, as shown in Figure 6A. The Raman spectra collected in this way look identical
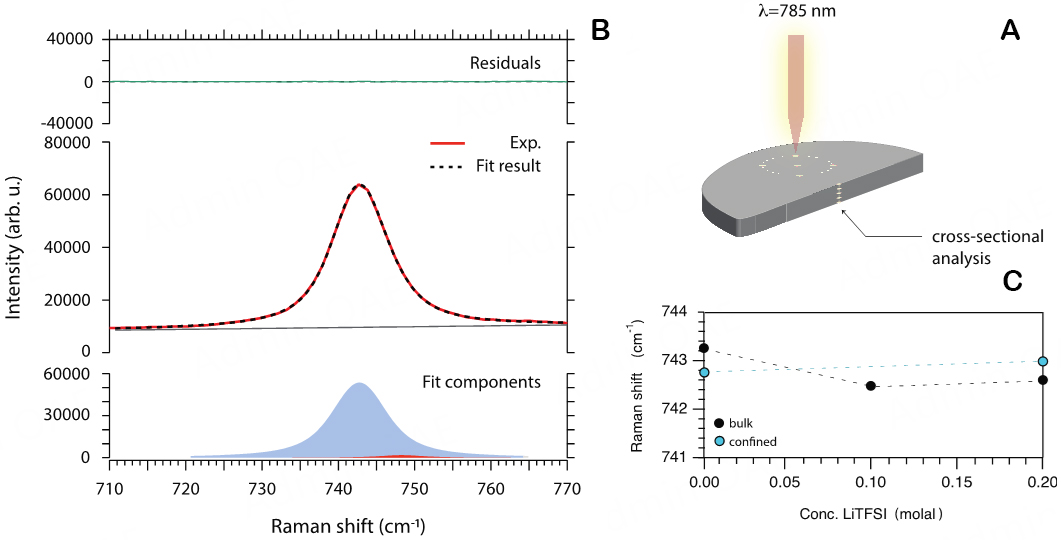
Figure 6. (A) Schematic for the collection of Raman spectra on selected spots across the material. (B) Example of peak fit analysis of a Raman spectrum. (C) Raman shifts of the interaction sensitive mode at 742 cm-1 (assigned to the expansion-contraction mode of the whole TFSI anion) as a function of composition for the bulk and for the confined liquid.
Another very important aspect that we have investigated is the nature of interactions established between the ionic species present in the liquid mixture, both in the bulk liquid and after confinement into the polymer matrix. Such interactions are typically investigated by analyzing the frequency of the expansion-contraction mode of TFSI, a strong Raman mode that is typically found in the range 741-744 cm-1 for weakly coordinated TFSI anions, e.g., in neat protic and aprotic ionic liquids based on the TFSI anion, in the liquid state[61-63]. By a thorough peak fit analysis of the collected Raman spectra (see an example in Figure 6B), we find that the main component of this vibrational mode varies slightly with composition and confinement but remains within the range declared above, Figure 6C. The frequency analysis of this vibrational mode indicates that the TFSI anion experiences similar interactions with its surroundings, with little dependence on the salt concentration or the surrounding polymeric network.
Ionic conductivity and mechanical stability
Quantitative insight into the impact of incorporating the liquid phase inside the polymer matrix on the ion conduction and mechanical properties can be obtained by means of dielectric spectroscopy and rheological measurements, respectively. Figure 7 shows the frequency dependence of the real part of the complex conductivity function, σ*(ω), for the undoped [Figure 7A] and the LiTFSI-doped [Figure 7B] solid electrolytes at selected temperatures. A comparison of conductivity spectra collected for EBPADMA +
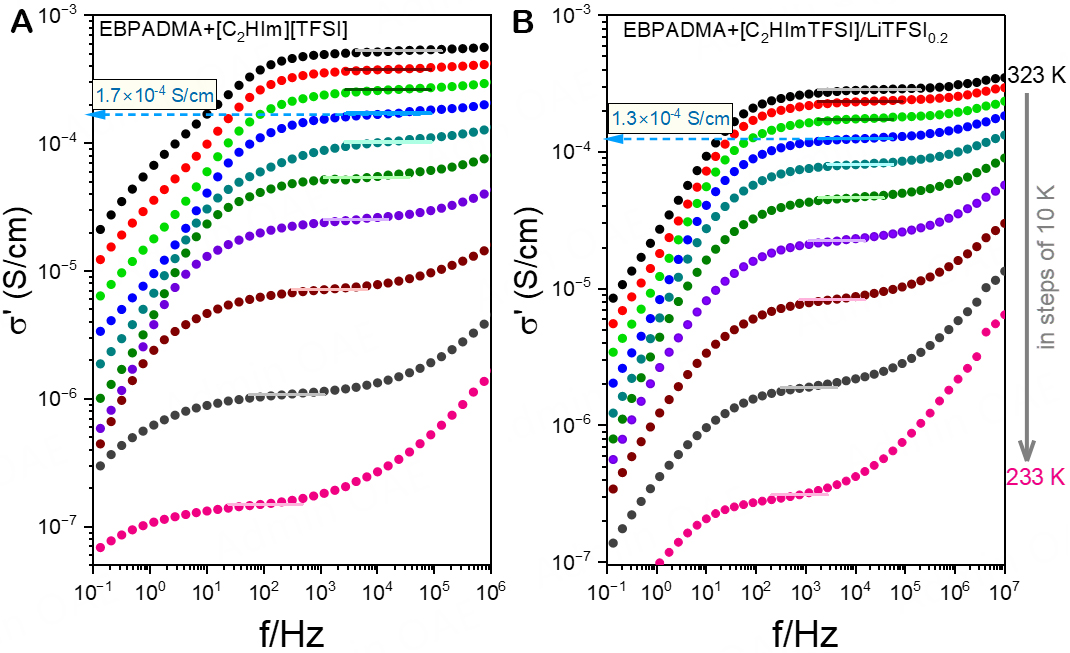
Figure 7. Frequency-dependence of the real part of the complex conductivity for (A) BPAEDMA+[C2HIm][TFSI] and (B) BPAEDMA+[C2HIm][TFSI]/LiTFSI0.2 at some selected temperatures, in steps of 10 K. The solid lines are linear fits used for determining the dc-conductivity.
At intermediate frequencies, the σ′(ω) curves exhibit a plateau associated with the dc-conductivity, which separates the high-frequency regime associated with ac-conductivity from the low-frequency dispersion associated with electrode polarization. Additionally, the dc-conductivity could also be extracted from the Nyquist plot, as shown in Supplementary Figure 9. The extracted dc-conductivity values of the methacrylate-based solid electrolytes are presented as a function of inverse temperature in Figure 8A. The ionic conductivity of the bulk liquid phase and the calorimetric Tgs are also included in this figure.
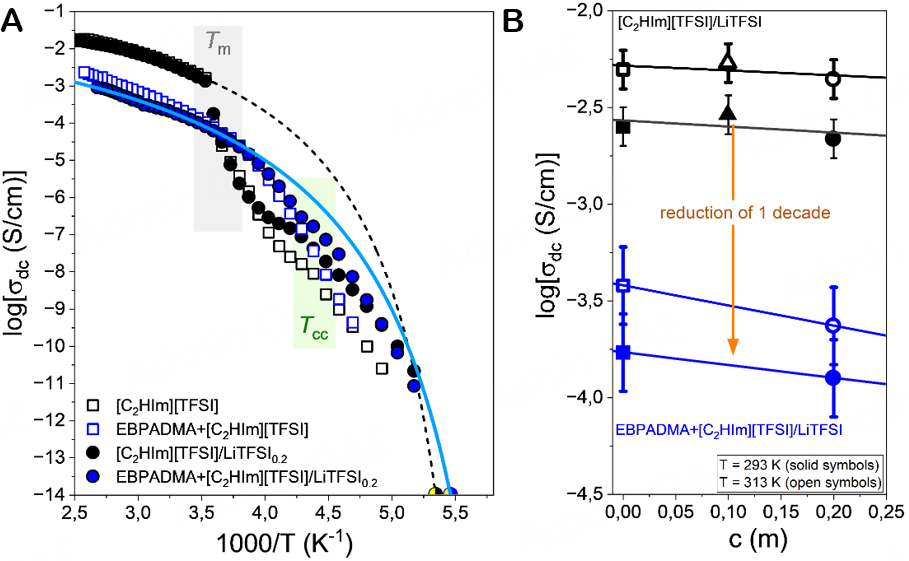
Figure 8. (A) Temperature-dependence of the ionic conductivity for the studied electrolytes; EBPADMA + [HC2Im][TFSI] (open blue symbols) and EBPADMA + [C2HIm][TFSI]/LiTFSI0.2 (solid blue symbols) in comparison with their respective bulk liquid electrolytes; [C2HIm][TFSI] (open black symbols) and [C2HIm][TFSI]/LiTFSI0.2 (filled black symbols), upon heating. The solid and dashed lines represent fits to Eq. 2 for the solid electrolyte and its corresponding bulk liquid electrolyte doped with LiTFSI at a Li-salt concentration of 0.2 m. The shadowed green and grey areas indicate the cold-crystallization and the melting, respectively. (B) Comparison of the ionic conductivity for the bulk (black symbols) and the confined (blue symbol) liquid phases at two temperatures: T = 293 K (filled symbols) and T = 313 K (open symbols).
As illustrated in Figure 8, the solid electrolytes exhibit about one order of magnitude lower conductivity than the corresponding bulk liquid phase. This is partly due to the fact that only 50% of the solid polymer electrolyte consists of the liquid electrolyte but mostly due to the morphology, which implies that the liquid phase encounters dead ends or narrow regions of pathways that limit or slow down the long-range translational ion diffusion between the two electrodes. After doping with LiTFSI at a concentration of 0.2 m, the conductivity slightly decreases (likely due to increased viscosity) and achieves a value of
where σ0≠ is the dc-conductivity in the limit of very high temperatures, B is a parameter related to the activation energy, and T0 is the “ideal” Tg, which differs from the calorimetric Tg by typically ~40-50 K. In the fitting procedure, the calorimetric Tg value was also included. The ionic conductivity at Tg was calculated by employing the Nernst-Einstein equation as
VFT parameters obtained from fitting conductivity data
| Sample | Log [σ0 (S/cm)] | B (K) | T0 (K) | R2 |
| [C2HIm][TFSI] | 0.58 ± 0.03 | 590 ± 10 | 166.0 ± 0.5 | 0.99998 |
| [C2HIm][TFSI]/LiTFSI0.2 | 0.67 ± 0.02 | 570 ± 10 | 166.6 ± 0.3 | 0.99996 |
| EBPADMA + [C2HIm][TFSI] | 0.93 ± 0.01 | 944 ± 7 | 148.6 ± 0.2 | 0.99996 |
| EBPADMA + [C2HIm][TFSI]/LiTFI0.2 | 1.61 ± 0.05 | 720 ± 20 | 157.8 ± 0.6 | 0.99987 |
As mentioned in the introduction, achieving mechanically robust solid electrolytes is often limited by the competing need for efficient ion transport. The mechanical properties of the investigated thermally cured methacrylate-based electrolytes were, hence, also analyzed by carrying out rheological measurements in an oscillatory mode as a function of temperature under isochronal conditions (ω = 10 rad/s) and as a function of frequency under isothermal conditions, that is at 318 K (T < TgEBPADMA) and at 373 K (T > TgEBPADMA). The results from these measurements are provided in Figure 9.
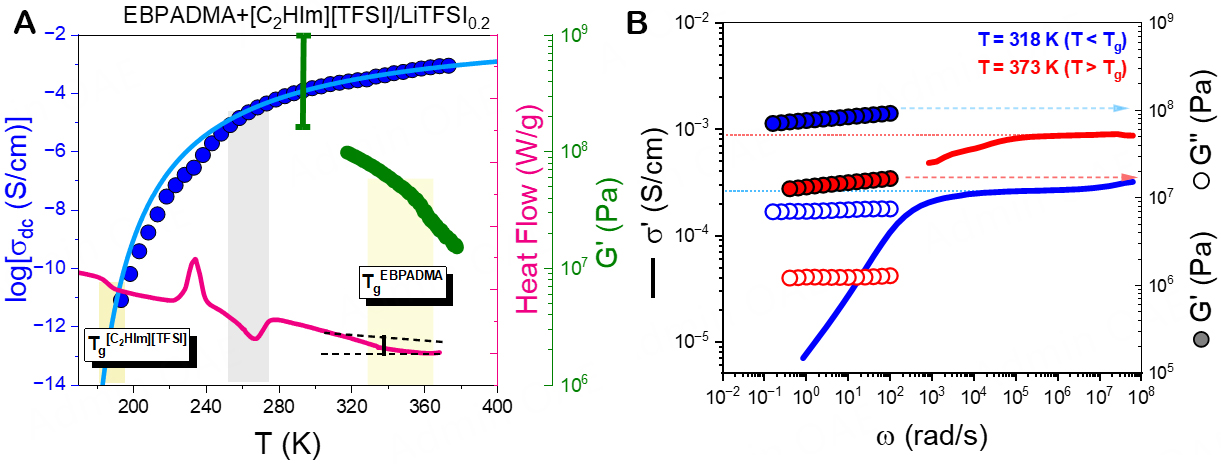
Figure 9. (A) Temperature dependence of the dc-conductivity (blue symbols), heat flow (rate = 10 K/min, magenta line), and mechanical storage moduli (green symbols, rate = 5 K/min, ω = 10 rad/s). The scale bar denotes the range of elastic storage moduli reported in the literature for SBEs with similar polymer matrices[13-25]. (B) Real part of the complex conductivity (solid lines) compared with the storage (filled circles) and loss (open circles) moduli at T = 318 K (T < Tg) (blue symbols) and T = 373 K (T > Tg) (red symbols).
As shown in Figure 9A, the temperature dependence of the shear storage modulus exhibits a weak and broad step change at around 360 K, associated with the TgEBPADMA. The broadness of this feature reflects the different degrees of cross-linking in the polymer matrix. It is also clear that the temperature dependence of the dc-conductivity remains unaffected by the Tg of the hard polymer phase, reflecting a strong segregation between the two phases. Quantitative insights into mechanical properties can be obtained by performing isothermal frequency sweeps into the linear viscoelastic regime, as shown in Figure 9B. At T = 318 K
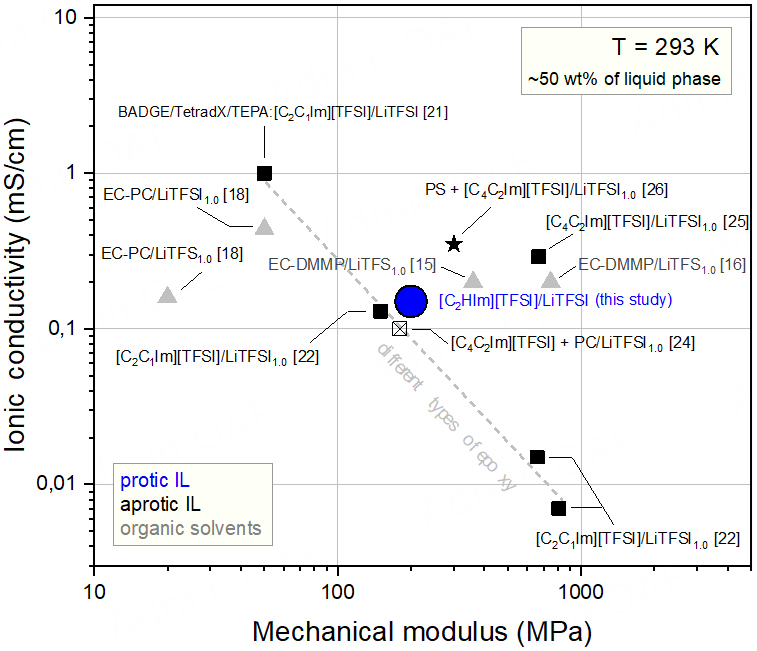
Figure 10. Multifunctionality plot that compares the properties of the structural battery electrolyte investigated in this study (blue solid circle) with those of other equivalent electrolytes reported in the literature, all being based on bisphenol A epoxy resin but different liquid phases of ionic liquids[21,22,24,25] or organic solvents[15,16,18]. A solid electrolyte based on a cross-linked polystyrene (PS) polymer matrix and an ion-conducting phase consisting of a mixture of poly(ethylene oxide) (PEO) and an aprotic ionic liquid is also included in this comparative plot[26].
The multifunctionality plot, as shown in Figure 10, evidences the trade-off between ion conduction and mechanical properties. It is worth mentioning that the room temperature ionic conductivity of the cross-linked structural electrolytes is more than two orders of magnitude higher than that found in different types of solid electrolytes previously studied (e.g., polymerized ionic liquids and block copolymer electrolytes based on the PEO conductive phase)[64-66], despite equivalent shear modulus (~100 MPa). However, the ionic conductivity of the investigated structural electrolytes remains one order of magnitude lower than the ionic conductivity of the bulk liquid phase and the target set for electrolytes intended to be used in structural batteries. To further increase the ionic conductivity of these materials, the effect of confinement and pore connectivity on the mobility of the liquid phase has to be better understood.
Relaxation dynamics - dynamic heterogeneity in the vicinity of Tg
Precise information about the ion dynamics and the coupled structural relaxation over a broad range of frequencies and temperatures can be obtained by combining dielectric spectroscopy measurements with TM-DSC[67-70]. The latter experimental technique provides quantitative insights into structural relaxation in ionic systems, for which strong electrode polarization effects prevent a dielectric identification of the structural α-process. Together, these two techniques enable us to understand the influence of confinement and morphology on the ion conduction process.
In ion-conducting systems, the imaginary part of the complex electric modulus, M″, emphasizes the contributions of translational ionic motions (ranging from long to short distances) that are associated with the conductivity process. From the peak frequency of M″, the characteristic relaxation time of the ionic motion can be extracted by employing the empirical function suggested by Kohlrausch, Williams, and Watts, which is expressed as:
where t is the time, τα is the characteristic conductivity relaxation time, and βKWW (0 < βKWW < 1) is the shape parameter related to the broadening of the relaxation peak. Lower values of βKWW denote broader and more asymmetric peaks. As proposed earlier by Bergman[71], the M″ peak can be directly fitted in the frequency domain by the following function:
where Mmax″ is the peak value of M″, and ωmax is the corresponding frequency. Some representative fitting curves are shown in Supplementary Figure 12 for the case of the σ-process. The inclusion of the bulk liquid phase into the polymer structure significantly affects the relaxation dynamics, as shown in Figure 11A, which compares the horizontally shifted electric modulus curves by employing the principle of time-temperature-superposition (tTs). The obtained shape parameter and relaxation map for the investigated solid and liquid electrolytes are shown in Figure 11B and C.

Figure 11. (A) Complex electric modulus (M″) curves shifted to the peak maximum of the σ-process by employing the tTs principle, at a reference temperature of 203 K, for the [C2HIm][TFSI] (grey symbols), C2HIm][TFSI]/LiTFSI0.2 (black symbols), EBPADMA +
From Figure 11, it becomes clear that the σ-process speeds up under confinement as a result of the lower Tg, in accordance with the results from TM-DSC data. This finding supports the hypothesis of weak interfacial interactions between the two phases (solid and liquid) and a clear impact of the geometrical confinement. The speeding-up in dynamics is less evident in the confined liquid phase doped with LiTFSI, despite the fact that the calorimetric Tg reduces by about 4 K [Supplementary Figure 13]. This indicates that the structural
The extracted relaxation times of the σ-process can be discussed together with the TM-DSC data with respect to the relaxation map of Figure 11C. Evidently, the σ-process is coupled to the structural α-process. The σ-process can be well described by the VFT equation[72,73]:
In this equation,
VFT parameters for the σ-process, glass transition temperature, and fragility parameter for the investigated electrolytes
| Dielectric spectroscopy | TMDSC | ||||||||
| Sample | -log(0/s)a (-τ0/s)a | B (K) | T0 (K) | Tg (K)b | R2 | m* | NaD | Tg (K) | ξa (nm) |
| [C2HIm][TFSI] | -12 | 1770 ± 10 | 128.1 ± 0.4 | 183.1 ± 0.4 | 0.9997 | 44 | 110 | 184 | 2.6 |
| [C2HIm][TFSI]/LiTFSI0.2 | -12 | 1550 ± 50 | 137 ± 2 | 185.0 ± 2.0 | 0.9784 | 50 | 115 | 187 | 2.7 |
| EBPADMA + [C2HIm][TFSI] | -12 | 1630 ± 20 | 128.7 ± 0.7 | 179.0 ± 0.7 | 0.9992 | 47 | 7 | 180 | 1.0 |
| EBPADMA + [C2HIm][TFSI]/LiTFSI0.2 | -12 | 1440 ± 30 | 138 ± 1 | 183.0 ± 1.0 | 0.9976 | 57 | 8 | 183 | 1.2 |
The steepness index or the fragility parameter, m, provides information about the temperature dependence of τσ and the coupled structural relaxation and can be extracted from the slope in the "fragility" plot of log(τ) vs. Tg/T. It can also be calculated by employing the VFT parameters as m* = BTg/[2.303(Tg-T0)2][74]. The values of m calculated in this way are reported in Table 2. We find that fragility slightly increases in the confined liquid phase, a similar trend to that found in, e.g., hydrogen-bonded liquids based on propylene glycol mono methyl ether (PGME) confined in two-dimensional vermiculite clay[46]. This suggests that the interaction between the molecules (network character) decreases in confinement, possibly due to an increase of the free volume and/or geometrical restrictions of orientational ordering.
Precise information about the heterogeneous dynamics and the dynamic nature of Tg can be obtained by taking into account the idea of cooperatively rearranging regions (CRR) introduced by Adam and Gibbs[75]. A CRR is defined as the smallest volume element that can rearrange to a new configuration independently of its environment. Based on the fluctuation theorem, Donth proposed a model for describing this volume as[76]:
where kB is the Boltzmann constant, and Δ(1/Cp) = 1/Cpglass - 1/Cpliquid calculated at Tg and δT (= ΔT/2.5) is the mean temperature fluctuation of a CRR. According to Donth’s prediction, considering a sphere with volume Va, the correlation length of Tg can be calculated as ξα = (3Va/4π)1/3 and the number of correlated molecules close to Tg as
where NA is the Avogadro number, R (= kB∙NA) is the gas constant, M is the molar mass of the repeating unit, and ρ is the density. The parameter values employed in the Donth model are taken from the TM-DSC data presented in Figure 4B. The values of Na and ξa are also provided in Table 2. However, it should be noted that the calculation of Na requires knowledge of the density of the confined liquid phase, a value that is difficult to estimate. Hence, we will emphasize our discussion only on the calculated length scale of Tg. The length scale of Tg decreases from 2.7 nm to 1.2 nm upon confinement for the structural electrolyte doped with LiTFSI, implying smaller regions of cooperativity in the confined liquid phase. This finding further supports the hypothesis of a lower liquid density in the pores, once again reflecting the impact of geometrical confinement.
This is the first time that the impact of confining a PIL into a polymer matrix on relaxation dynamics and associated local ionic mobility has been investigated by employing a combination of dielectric spectroscopy and TM-DSC. These techniques are well-known in the research field of polymer science (covering more than eight decades of frequencies) but have not been used in the research field of Structural Batteries to study the local dynamics. In contrast, we provide the first insights into how the local relaxation dynamics and the associated local ionic mobility are affected by the confinement in the porous polymer network. We demonstrate that the dynamics are enhanced by the confinement despite the relatively strong reduction of the macroscopic ionic conductivity. This emphasizes the importance of synthesizing a polymer network with percolating pores (i.e., minimizing the number of dead-ends) for reaching the desired ionic conductivity in the design of novel Structural Electrolytes.
CONCLUSIONS
In this work, we investigate the ion coordination, the thermodynamic properties, the ionic conductivity, the morphological properties, and the mechanical stability in nanophase-separated SBEs, composed of methacrylate-based polymer (EBPADMA) combined with the imidazolium PIL [C2HIm][TFSI] doped with LiTFSI. To the best of our knowledge, this is the first study of a PIL incorporated into a methacrylate-based polymer matrix. We report that the confinement of the liquid phase significantly reduces the degree of crystallinity, yielding almost amorphous electrolytes. Moreover, we report a speeding-up of ion dynamics that are coupled to the structural relaxation, hence a reduction of Tg by about 4 K. The latter implies that the interfacial interactions are weak and that the geometrical confinement effect is the main factor that dictates the local ion dynamics and the coupled structural relaxation. Furthermore, the Raman spectroscopy results show that the TFSI anion establishes spectroscopically weak interactions with its surroundings, even upon confinement. However, despite the speeding-up of the molecular motions in confinement (at least at temperatures close to Tg), the dc-conductivity decreases upon confinement to σdc ~ 0.13 mS/cm at T = 293 K, which is one decade lower than the value of the bulk liquid phase. The reason for this is likely the presence of some non-percolating pores, which reduces the long-range translation of the ions. Thus, to reach the desired dc-conductivity of 1 mS/cm for these types of SBEs, it will be essential to improve the connectivity and network character of the pores. Moreover, since three mobile ions (Im+, TFSI-, and Li+) contribute to the measured total ionic conductivity, the Li+ transference number will have to be measured by, e.g., diffusion-NMR. On the other hand, we report that the solid electrolytes exhibit the required mechanical stability needed to carry the mechanical loads between the carbon fibers in structural batteries. Overall, we conclude that microphase-separated copolymer electrolytes consisting of a methacrylate-based polymer matrix and protic imidazolium ionic liquids doped with LiTFSI are promising for use in future mass-less structural batteries.
SUPPORTING INFORMATION
Additional TGA, SEM images, TM-DSC, Raman spectroscopy, and dielectric spectroscopy data.
DECLARATIONS
Acknowledgments
This work was financially supported by a grant from the Area of Advance Materials Science at Chalmers University of Technology. The authors also thank Dr. Andreas Schaefer for help in the nitrogen sorption measurements and Dr. Mei Qun Seah for help with the SEM images.
Authors’ contributions
DSC-TMDSC, dielectric and rheological experiments, data analysis, writing most of the first draft of the manuscript: Pipertzis A
Synthesis of SBEs and their respective bulk liquid phases, TGA, textural and morphological analysis (nitrogen sorption and SEM), Raman experiments and Raman data analysis, writing parts of the first draft of the manuscript: Abdou N
Mixing of liquid electrolytes, interpretation of results, contributing to the writing of the manuscript: Xu J
Conceptualization, interpretation of results, contributing to the writing of the manuscript: Asp LE
Conceptualization, data interpretation, contributing to the writing of the manuscript: Martinelli A
Conceptualization, data interpretation, contributing to the writing of the manuscript: Swenson J
Availability of data and materials
The data is available on request.
Financial support and sponsorship
This work was financially supported by a grant from the Area of Advance Materials Science at Chalmers University of Technology.
Conflicts of Interest
All authors declared that there are no conflicts of interest.
Ethical approval and consent to participate
Not applicable.
Consent for publication
Not applicable.
Copyright
© The Author(s) 2023.
Supplementary Materials
REFERENCES
1. Goodenough JB. Electrochemical energy storage in a sustainable modern society. Energy Environ Sci 2014;7:14-8.
2. Tarascon JM, Armand M. Issues and challenges facing rechargeable lithium batteries. Nature 2001;414:359-67.
3. Asp LE, Johansson M, Lindbergh G, Xu J, Zenkert D. Structural battery composites: a review. Funct Compos Struct 2019;1:042001.
4. Asp LE, Bouton K, Carlstedt D, et al. A structural battery and its multifunctional performance. Adv Energy Sustain Res 2021;2:2000093.
5. Lim GJH, Chan KK, Sutrisnoh NAA, Srinivasan M. Design of structural batteries: carbon fibers and alternative form factors. Mater Today Sustain 2022;20:100252.
6. Greenhalgh ES, Nguyen S, Valkova M, Shirshova N, Shaffer MSP, Kucernak ARJ. A critical review of structural supercapacitors and outlook on future research challenges. Compos Sci Technol 2023;235:109968.
7. Jin T, Singer G, Liang K, Yang Y. Structural batteries: advances, challenges and perspectives. Mater Today 2023;62:151-67.
8. Danzi F, Salgado RM, Oliveira JE, Arteiro A, Camanho PP, Braga MH. Structural batteries: a review. Molecules 2021;26:2203.
9. Carlstedt D, Asp LE. Performance analysis framework for structural battery composites in electric vehicles. Compos B Eng 2020;186:107822.
10. Ishfaq A, Nguyen SN, Greenhalgh ES, et al. Multifunctional design, feasibility and requirements for structural power composites in future electric air taxis. J Compos Mater 2023;57:817-27.
11. Kühnelt H, Beutl A, Mastropierro F, et al. Structural batteries for aeronautic applications - state of the art, research gaps and technology development needs. Aerospace 2022;9:7.
12. Thomas JP, Qidwai SM, Pogue WR III, Pham GT. Multifunctional structure-battery composites for marine systems. J Compos Mater 2013;47:5-26.
13. Tan MY, Safanama D, Goh SS, et al. Concepts and emerging trends for structural battery electrolytes. Chem Asian J 2022;17:e202200784.
14. Snyder JF, Carter RH, Wetzel ED. Electrochemical and mechanical behavior in mechanically robust solid polymer electrolytes for use in multifunctional structural batteries. Chem Mater 2007;19:3793-801.
15. Ihrner N, Johannisson W, Sieland F, Zenkert D, Johansson M. Structural lithium ion battery electrolytes via reaction induced phase-separation. J Mater Chem A 2017;5:25652-9.
16. Schneider LM, Ihrner N, Zenkert D, Johansson M. Bicontinuous electrolytes via thermally initiated polymerization for structural lithium ion batteries. ACS Appl Energy Mater 2019;2:4362-9.
17. Cattaruzza M, Fang Y, Furó I, Lindbergh G, Liu F, Johansson M. Hybrid polymer-liquid lithium ion electrolytes: effect of porosity on the ionic and molecular mobility. J Mater Chem A 2023;11:7006-15.
18. Fu Y, Chen Y, Yu X, Zhou L. Fiber metal laminated structural batteries with multifunctional solid polymer electrolytes. Compos Sci Technol 2022;230:109731.
19. Choi J, Zabihi O, Varley R, Zhang J, Fox BL, Naebe M. Multiple hydrogen bond channel structural electrolyte for an enhanced carbon fiber composite battery. ACS Appl Energy Mater 2022;5:2054-66.
20. Choi J, Zabihi O, Varley RJ, Fox B, Naebe M. High performance carbon fiber structural batteries using cellulose nanocrystal reinforced polymer electrolyte. ACS Appl Mater Interfaces 2022;14:45320-32.
21. Matsumoto K, Endo T. Confinement of ionic liquid by networked polymers based on multifunctional epoxy resins. Macromolecules 2008;41:6981-6.
22. Shirshova N, Bismarck A, Carreyette S, et al. Structural supercapacitor electrolytes based on bicontinuous ionic liquid-epoxy resin systems. J Mater Chem A 2013;1:15300-9.
23. Shirshova N, Bismarck A, Greenhalgh ES, et al. Composition as a means to control morphology and properties of epoxy based dual-phase structural electrolytes. J Phys Chem C 2014;118:28377-87.
24. Yu Y, Zhang B, Feng M, et al. Multifunctional structural lithium ion batteries based on carbon fiber reinforced plastic composites. Compos Sci Technol 2017;147:62-70.
25. Kwon SJ, Kim T, Jung BM, Lee SB, Choi UH. Multifunctional epoxy-based solid polymer electrolytes for solid-state supercapacitors. ACS Appl Mater Interfaces 2018;10:35108-17.
26. Schulze MW, McIntosh LD, Hillmyer MA, Lodge TP. High-modulus, high-conductivity nanostructured polymer electrolyte membranes via polymerization-induced phase separation. Nano Lett 2014;14:122-6.
27. Armand M, Endres F, MacFarlane DR, Ohno H, Scrosati B. Ionic-liquid materials for the electrochemical challenges of the future. Nat Mater 2009;8:621-9.
28. Abdurrokhman I, Elamin K, Danyliv O, Hasani M, Swenson J, Martinelli A. Protic ionic liquids based on the alkyl-imidazolium cation: effect of the alkyl chain length on structure and dynamics. J Phys Chem B 2019;123:4044-54.
29. Martinelli A, Matic A, Jacobsson P, Börjesson L, Fernicola A, Scrosati B. Phase behavior and ionic conductivity in lithium bis(trifluoromethanesulfonyl)imide-doped ionic liquids of the pyrrolidinium cation and bis(trifluoromethanesulfonyl)imide anion. J Phys Chem B 2009;113:11247-51.
30. Pitawala J, Kim JK, Jacobsson P, Koch V, Croce F, Matic A. Phase behaviour, transport properties, and interactions in Li-salt doped ionic liquids. Faraday Discuss 2012;154:71-80; discussion 81-96, 465-71.
31. Martinelli A, Matic A, Johansson P, et al. Conformational evolution of TFSI- in protic and aprotic ionic liquids. J Raman Spectrosc 2011;42:522-8.
32. Nasrabadi AT, Ganesan V. Structure and transport properties of lithium-doped aprotic and protic ionic liquid electrolytes: insights from molecular dynamics simulations. J Phys Chem B 2019;123:5588-600.
33. Jafta CJ, Bridges C, Haupt L, et al. Ion dynamics in ionic-liquid-based li-ion electrolytes investigated by neutron scattering and dielectric spectroscopy. ChemSusChem 2018;11:3512-23.
34. Singh MP, Singh RK, Chandra S. Ionic liquids confined in porous matrices: physicochemical properties and applications. Prog Mater Sci 2014;64:73-120.
35. Abdou N, Alonso B, Brun N, et al. Ionic guest in ionic host: ionosilica ionogel composites via ionic liquid confinement in ionosilica supports. Mater Chem Front 2022;6:939-47.
36. Abdou N, Alonso B, Brun N, et al. Confinement effects on the ionic liquid dynamics in ionosilica ionogels: impact of the ionosilica nature and the host/guest ratio. J Phys Chem C 2022;126:20937-45.
37. Martinelli A, Nordstierna L. An investigation of the sol-gel process in ionic liquid-silica gels by time resolved Raman and 1H NMR spectroscopy. Phys Chem Chem Phys 2012;14:13216-23.
38. Martinelli A. Conformational changes and phase behaviour in the protic ionic liquid 1-ethylimidazolium bis(trifluoromethylsulfonyl)imide in the bulk and nano-confined state. Eur J Inorg Chem 2015;2015:1300-8.
39. Nayeri M, Aronson MT, Bernin D, Chmelka BF, Martinelli A. Surface effects on the structure and mobility of the ionic liquid C6C1ImTFSI in silica gels. Soft Matter 2014;10:5618-27.
40. Vavra S, Elamin K, Evenäs L, Martinelli A. Transport properties and local structure of an imidazole/protic ionic liquid mixture confined in the mesopores of hydrophobic silica. J Phys Chem C 2021;125:2607-18.
41. Morais EM, Abdurrokhman I, Martinelli A. Solvent-free synthesis of protic ionic liquids. Synthesis, characterization and computational studies of triazolium based ionic liquids. J Mol Liq 2022;360:119358.
42. Menne S, Pires J, Anouti M, Balducci A. Protic ionic liquids as electrolytes for lithium-ion batteries. Electrochem Commun 2013;31:39-41.
43. Cerveny S, Mallamace F, Swenson J, Vogel M, Xu L. Confined water as model of supercooled water. Chem Rev 2016;116:7608-25.
44. Swenson J, Cerveny S. Dynamics of deeply supercooled interfacial water. J Phys Condens Matter 2015;27:033102.
45. Swenson J, Elamin K, Jansson H, Kittaka S. Why is there no clear glass transition of confined water? Chem Phys 2013;424:20-5.
46. Cerveny S, Mattsson J, Swenson J, Bergman R. Relaxations of hydrogen-bonded liquids confined in two-dimensional vermiculite clay. J Phys Chem B 2004;108:11596-603.
47. Swenson J, Jansson H, Bergman R. Relaxation processes in supercooled confined water and implications for protein dynamics. Phys Rev Lett 2006;96:247802.
48. Ananiadou A, Papamokos G, Steinhart M, Floudas G. Effect of confinement on the dynamics of 1-propanol and other monohydroxy alcohols. J Chem Phys 2021;155:184504.
49. Tu CH, Veith L, Butt HJ, Floudas G. Ionic conductivity of a solid polymer electrolyte confined in nanopores. Macromolecules 2022;55:1332-41.
50. Iacob C, Sangoro JR, Kipnusu WK, Valiullin R, Kärger J, Kremer F. Enhanced charge transport in nano-confined ionic liquids. Soft Matter 2012;8:289-93.
51. Tu W, Chat K, Szklarz G, et al. Dynamics of pyrrolidinium-based ionic liquids under confinement. II. the effects of pore size, inner surface, and cationic alkyl chain length. J Phys Chem C 2020;124:5395-408.
52. Berrod Q, Ferdeghini F, Judeinstein P, et al. Enhanced ionic liquid mobility induced by confinement in 1D CNT membranes. Nanoscale 2016;8:7845-8.
53. Alexandris S, Papadopoulos P, Sakellariou G, Steinhart M, Butt HJ, Floudas G. Interfacial energy and glass temperature of polymers confined to nanoporous alumina. Macromolecules 2016;49:7400-14.
54. Alcoutlabi M, McKenna GB. Effects of confinement on material behaviour at the nanometre size scale. J Phys Condens Matter 2005;17:461.
55. Busselez R, Lefort R, Ji Q, Affouard F, Morineau D. Molecular dynamics simulation of nanoconfined glycerol. Phys Chem Chem Phys 2009;11:11127-33.
56. Brunauer S, Emmett PH, Teller E. Adsorption of gases in multimolecular layers. J Am Chem Soc 1938;60:309-19.
57. Barrett EP, Joyner LG, Halenda PP. The determination of pore volume and area distributions in porous substances. I. computations from nitrogen isotherms. J Am Chem Soc 1951;73:373-80.
58. Wunderlich B, Jin Y, Boller A. Mathematical description of differential scanning calorimetry based on periodic temperature modulation. Thermochim Acta 1994;238:277-93.
59. Simon SL. Temperature-modulated differential scanning calorimetry: theory and application. Thermochim Acta 2001;374:55-71.
60. Shin WS, Li XF, Schwartz B, Wunder SL, Baran GR. Determination of the degree of cure of dental resins using Raman and FT-Raman spectroscopy. Dent Mater 1993;9:317-24.
61. Gejji SP, Suresh CH, Babu K, Gadre SR. Ab initio structure and vibrational frequencies of (CF3SO2)2N- Li+ ion pairs. J Phys Chem A 1999;103:7474-80.
62. Guyomard-Lack A, Delannoy PE, Dupré N, Cerclier CV, Humbert B, Le Bideau J. Destructuring ionic liquids in ionogels: enhanced fragility for solid devices. Phys Chem Chem Phys 2014;16:23639-45.
63. Aidoud D, Guy-bouyssou D, Guyomard D, Bideau JL, Lestriez B. Photo-polymerized organic host network of ionogels for lithium batteries: effects of mesh size and of ethylene oxide content. J Electrochem Soc 2018;165:A3179.
64. Dreier P, Pipertzis A, Spyridakou M, Mathes R, Floudas G, Frey H. Introduction of trifluoromethanesulfonamide groups in poly(ethylene oxide): ionic conductivity of single-ion-conducting block copolymer electrolytes. Macromolecules 2022;55:1342-53.
65. Pipertzis A, Kafetzi M, Giaouzi D, Pispas S, Floudas GA. Grafted copolymer electrolytes based on the poly(acrylic acid-co-oligo ethylene glycol acrylate) (P(AA-co-OEGA)) ion-conducting and mechanically robust block. ACS Appl Polym Mater 2022;4:7070-80.
66. Pipertzis A, Papamokos G, Mühlinghaus M, Mezger M, Scherf U, Floudas G. What determines the glass temperature and dc-conductivity in imidazolium-polymerized ionic liquids with a polythiophene backbone? Macromolecules 2020;53:3535-50.
68. Wojnarowska Z, Paluch M. Recent progress on dielectric properties of protic ionic liquids. J Phys Condens Matter 2015;27:073202.
69. Griffin P, Agapov AL, Kisliuk A, et al. Decoupling charge transport from the structural dynamics in room temperature ionic liquids. J Chem Phys 2011;135:114509.
70. Musiał M, Cheng S, Wojnarowska Z, Paluch M. Magnitude of dynamically correlated molecules as an indicator for a dynamical crossover in ionic liquids. J Phys Chem B 2021;125:4141-7.
71. Bergman R. General susceptibility functions for relaxations in disordered systems. J Appl Phys 2000;88:1356-65.
73. Floudas G. 2.32 - Dielectric spectroscopy. In: Matyjaszewski K, Möller M, editors. Polymer science: a comprehensive reference. Amsterdam: Elsevier; 2012. pp. 825-45.
74. Ngai KL, Floudas G, Plazek DJ, Rizos AK. Amorphous polymers. In: Mark HF, editor. Encyclopedia of Polymer science and technology. New York: John Wiley & Sons; 2002.
75. Adam G, Gibbs JH. On the temperature dependence of cooperative relaxation properties in glass-forming liquids. J Chem Phys 1965;43:139-46.
Cite This Article
Export citation file: BibTeX | RIS
OAE Style
Pipertzis A, Abdou N, Xu J, Asp LE, Martinelli A, Swenson J. Ion transport, mechanical properties and relaxation dynamics in structural battery electrolytes consisting of an imidazolium protic ionic liquid confined into a methacrylate polymer. Energy Mater 2023;3:300050. http://dx.doi.org/10.20517/energymater.2023.49
AMA Style
Pipertzis A, Abdou N, Xu J, Asp LE, Martinelli A, Swenson J. Ion transport, mechanical properties and relaxation dynamics in structural battery electrolytes consisting of an imidazolium protic ionic liquid confined into a methacrylate polymer. Energy Materials. 2023; 3(6): 300050. http://dx.doi.org/10.20517/energymater.2023.49
Chicago/Turabian Style
Pipertzis, Achilleas, Nicole Abdou, Johanna Xu, Leif E. Asp, Anna Martinelli, Jan Swenson. 2023. "Ion transport, mechanical properties and relaxation dynamics in structural battery electrolytes consisting of an imidazolium protic ionic liquid confined into a methacrylate polymer" Energy Materials. 3, no.6: 300050. http://dx.doi.org/10.20517/energymater.2023.49
ACS Style
Pipertzis, A.; Abdou N.; Xu J.; Asp LE.; Martinelli A.; Swenson J. Ion transport, mechanical properties and relaxation dynamics in structural battery electrolytes consisting of an imidazolium protic ionic liquid confined into a methacrylate polymer. Energy Mater. 2023, 3, 300050. http://dx.doi.org/10.20517/energymater.2023.49
About This Article
Special Issue
Copyright

Data & Comments
Data
0

 Cite This Article 23 clicks

 Like This Article 5
likes
Like This Article 5
likes


Comments
Comments must be written in English. Spam, offensive content, impersonation, and private information will not be permitted. If any comment is reported and identified as inappropriate content by OAE staff, the comment will be removed without notice. If you have any queries or need any help, please contact us at support@oaepublish.com.